Figure 2.

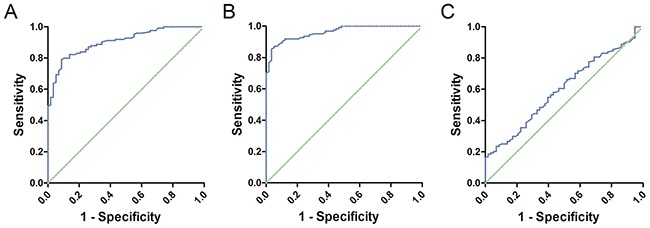
(A) ROC curve of Alu: The Area Under Curve was 0.904. (B) ROC curve of MGMT: The Area Under Curve was 0.962. (C) ROC curve of P16: The Area Under Curve was 0.599.

(A) ROC curve of Alu: The Area Under Curve was 0.904. (B) ROC curve of MGMT: The Area Under Curve was 0.962. (C) ROC curve of P16: The Area Under Curve was 0.599.