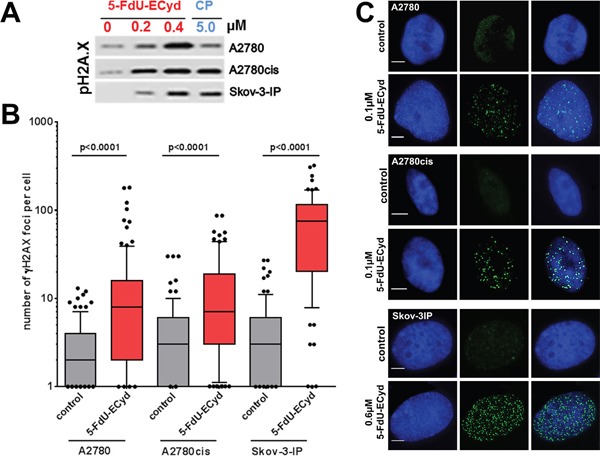
Figure 4. DNA double strand break analysis in 5-FdU-ECyd treated cells.

(A) Western blot analysis, analyzing phosphorylated histone H2AX in A2780, A2780cis and Skov-3-IP cells, following treatment with 5-FdU-ECyd or cisplatin. (B) Quantification of immunofluorescent γH2AX foci analysis in platinum sensitive A2780 and platinum-resistant A2780cis cells, following treatment with 5-FdU-ECyd (A2780 and A2780cis: 0.1 μM; Skov-3-IP 0.4 μM) for 48 h. The detection of γH2AX foci is a surrogate marker for DNA double strand brakes. γH2AX foci were counted and averaged across a hundred randomly selected cells per condition and are plotted along a logarithmic scale (log10). The whiskers are drawn down to the 10th percentile and up to the 90th. Points below and above the whiskers are drawn as individual dots. The line in the middle of the box is plotted at the median. (C) Representative immunofluorescent images of double strand break analysis with nucleic staining (Hoechst 33342, blue, first row), γH2AX foci staining (Alexa Flour 488, green, second row) and merged images (third row).
