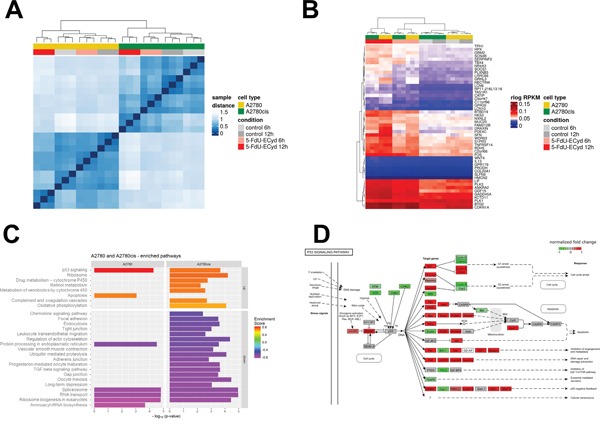
Figure 6. Transcriptome analysis of 5-FdU-ECyd treated platinum-sensitive and platinum resistant ovarian cancer cells.

(A) Heat map from hierarchical clustering of Euclidian sample distances based on regularized logarithmic (rlog) transformed expression values of all genes of all samples. The top color bar represents the cell line and the second color bar the treatment type. Each row and column denotes a sample. The dendrogram on the x-axis shows the grouping of samples according to biological replicates (triplicates), treatment and cell type. (B) Heat map showing hierarchical clustering based on 50 top ranking differentially expressed genes between 5-FdU-ECyd treated and untreated cells in A2780 and A2780cis (rlog transformed data). The top color bar represents the cell line and the second color bar the treatment type. Each row denotes a single gene and their expression pattern across the samples. The dendrogram on the x-axis shows the grouping of same samples. The two main groups are defined by treated and untreated cells (red and grey columns), and within those groups further separating according to cell type (A2780 in yellow and A2780cis in green) and biological replicates (triplicates). (C) Bar chart shows commonly or uniquely enriched pathways after short term 5-FdU-ECyd exposure (1 μM for 12 h) of platinum-sensitive (A2780) and platinum-resistant (A2780cis) ovarian cancer cells. Bar lengths correspond to -log10(p-value) of the enrichment hypothesis test, while bar colors represent enrichment scores (ES). Pathways are vertically sorted by ES and thereby divided into up-regulated (ES>0) and down-regulated (ES<0) ones. (D) Figure showing deregulation of the p53-pathway following 5-FdU-ECyd treatment of A2780 cells. Normalized log2 FCs after 12 h treatment are color coded. KEGG pathways were plotted using the R package pathview [44].
