
Figure 4. Differentiation of tumor cells in the directly co-culture system.
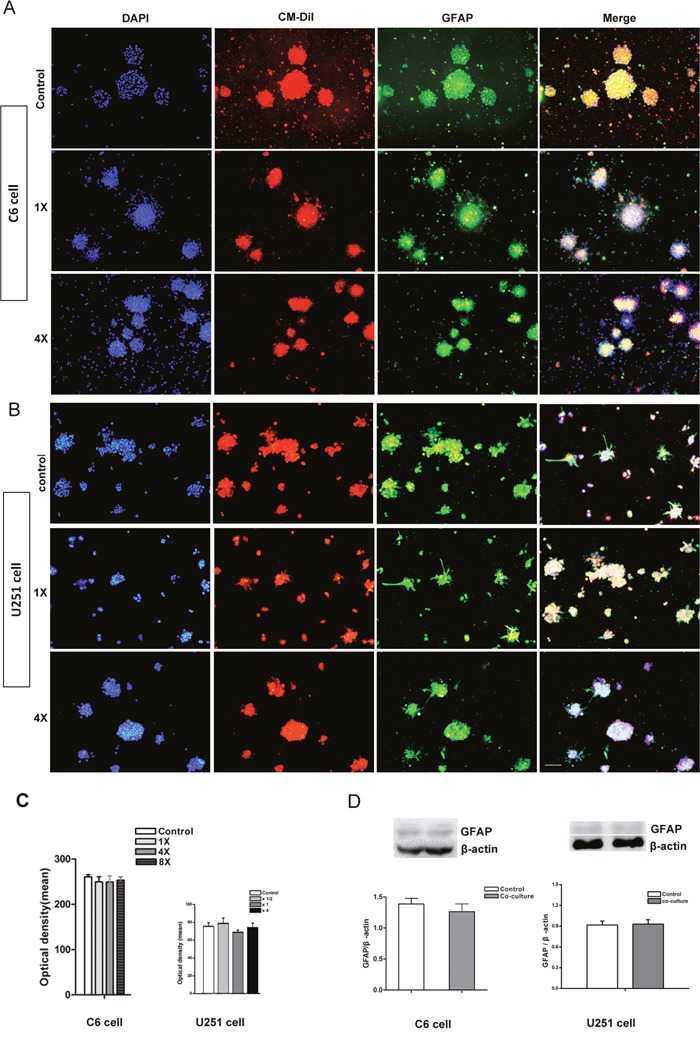
(A) Immunocytochemistry staining showed that almost all of the CM-DiI labeled C6 cells were GFAP positive. (B) Immunocytochemistry staining showed that almost all of the CM-DiI labeled U251 cells were GFAP positive. (C) The intensity of GFAP fluorescent measured by image-pro plus 5.0 software showed that there was no significant difference between different groups. (D) Western blot quantifying the GFAP protein in whole co-culture system showed that there was no significant difference between different groups. DAPI used for cell nuclei staining showed in blue, CM-DiI showed in red and GFAP showed in green. 1× and 4× mean the ratio of tumor cells verse NSCs were 1 to 1 and 1 to 4. Scale bar = 50 μm.