
Figure 6. Differentiation of tumor cell in the indirectly co-culture system.
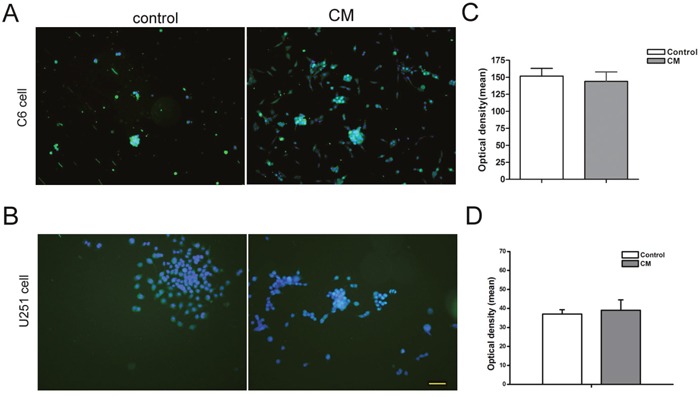
(A and B) Immunocytochemistry staining showed the GFAP positive cells. (C and D) The intensity of GFAP fluorescent assay showed that there was no significant difference between different groups. DAPI used for cell nuclei staining was showed in blue, GFAP showed in green. CM means condition medium. Scale bar=50 μm.