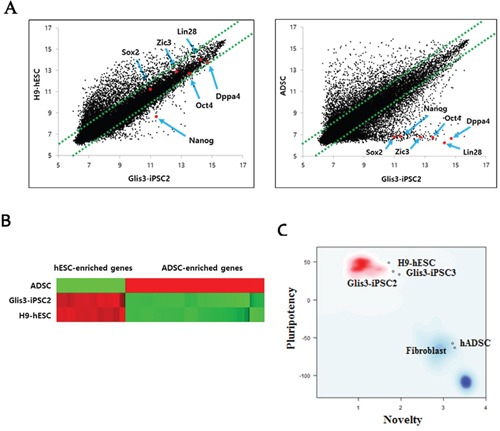
Figure 6. Genome-wide gene expression profiling of Glis3-iPSCs.

(A) Scatterplot analysis showed that the global gene expression pattern of Glis3-iPSCs was similar to that of H9-hESCs. However, the gene expression patterns were clearly different between Glis3-iPSCs and their parental cells, i.e., hADSCs. (B) Heatmap analysis indicated that the expression patterns of 80 hESC-enriched genes (Supplementary Table 5) and 96 hADSC-enriched genes (Supplementary Table 6) in Glis3-iPSCs were similar to those in H9-hESCs but different from those in hADSCs. (C) PluriTest, a gene expression-based bioinformatics diagnostic test for evaluating pluripotency [18], showed that the two Glis3-iPSC lines (Glis3-iPSC2 and Glis3-iPSC3) were indeed fully reprogrammed pluripotent stem cells.
