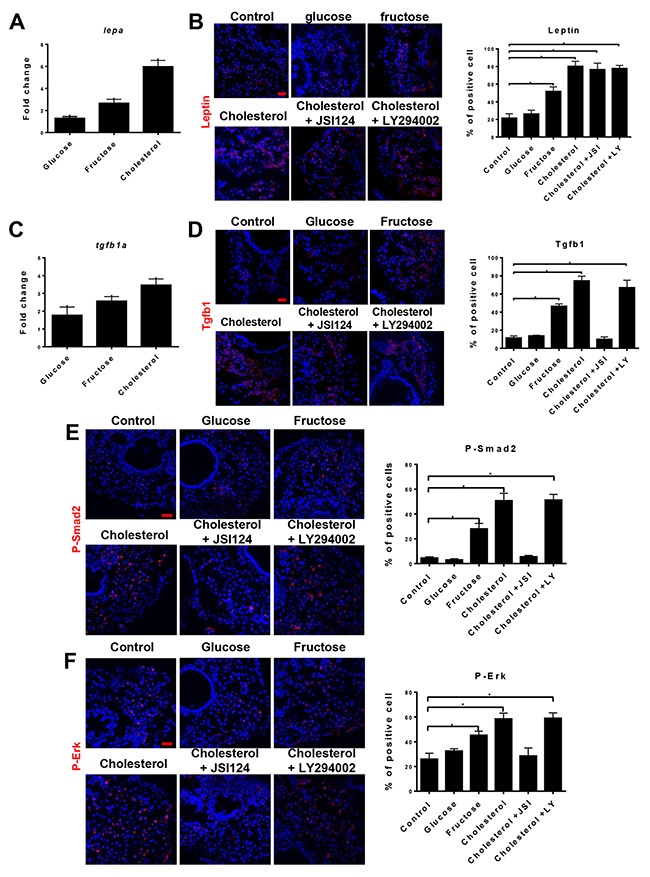
Figure 2. NASH induced Leptin and TGFβ1 signaling.

5-dpf larvae were fed for 7 days with normal (control) diet or infused diets with 10% glucose, 10% fructose, 10% cholesterol, 1 μM JSI124 (STAT3 inhibitor)+10% cholesterol or 1 μM LY294002 (PI3K inhibitor)+10% cholesterol and these larvae were examined for lepa and tgfb1a expression and downstream signaling. (A) RT-qPCR determination of lepa expression in hepatocytes isolated from fabp10+ larvae fed with different diets. Fold changes are expression values in larvae on different diets against those on normal diet. (B) Immunofluorescent staining of Leptin in the liver sections of larvae on different diets (left) and quantification of percentage of Leptin+ cells in the liver sections (right, n=20/group). (C) RT-qPCR determination of tgfb1a expression in hepatocytes isolated from fabp10+ larvae fed with different diets. Fold changes are expression values in larvae on different diets against those on normal diet. (D) Immunofluorescent staining of Tgfb1 (red) in liver sections of larvae on different diets (left) and quantification of percentage of Tgfb1+ cells in the liver sections (right, n=20/group). (E) Immunofluorescent staining of P-Smad2 (red) in liver sections of larvae on different diets and quantification of percentage of P-Smad2 positive cells in the liver sections (right, n=20/group). (F) Immunofluorescent staining of P-Erk (red) in liver sections of larvae on different diets and quantification of percentage of P-Erk+ cells in the liver sections (right, n=20/group). Scale bars, 20 μm. Statistical significance, *p<0.05.
