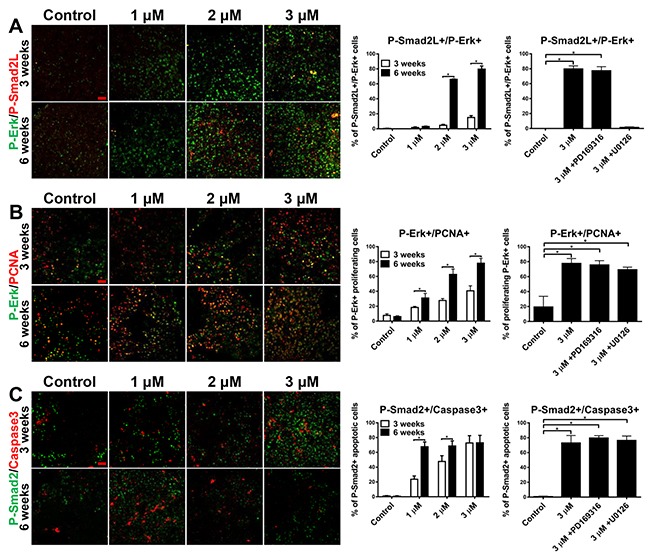
Figure 6. Molecular switch of dominant signaling pathway during chronic tgfb1a induction.

3-month-old tgfb1a+ transgenic zebrafish were treated with 1 μM (low), 2 μM (medium) and 3 μM (high) mifepristone for 6 weeks. For inhibitor experiments, 1 μM of either PD169316 (Smad2 inhibitor) or U0126 (MEK inhibitor) was introduced in the high-induction group after three weeks of mifepristone treatment. (A) Immunofluorescent co-staining of P-Erk/P-Smad2L on liver sections of these tgfb1a+ zebrafish (n=20/group). (B) Immunofluorescent co-staining of P-Erk/PCNA on liver sections of these tgfb1a+ zebrafish (n=20/group). (C) Immunofluorescent co-staining of P-Smad2/Caspase 3 on liver sections of these tgfb1a+ zebrafish (n=20/group). Scale bars, 20 μm. Statistical significance, *p<0.05. Control groups were tgfb1a+ zebrafish without mifepristone induction.
