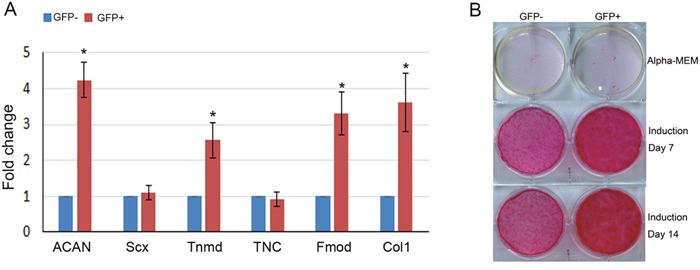
Figure 1. Tenogenic differentiation of GFP-positive and negative hMSCs.

(A) Total RNA was extracted from GFP-positive and negative hMSCs selected by flow cytometry. The relative expression levels of ACAN, Scx, Tnmd, TNC, Fmod and Collagen type I were evaluated by qRT-PCR. β-actin was used as an internal control. The data are expressed as mean ± SD (n=3), *p<0.05. (B) The MSCs were treated with tenogenic induction medium for 7 and 14 days, then Sirius Red staining was performed.
