
Figure 2. RNAseq analysis of gene expression profile of GFP-positive and negative hMSCs.
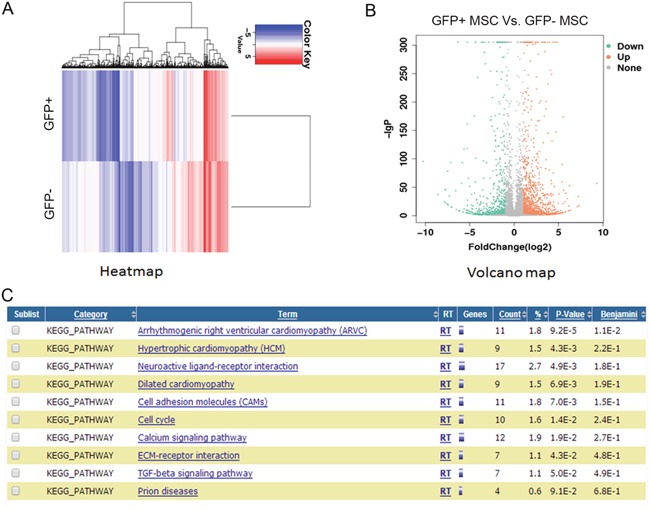
(A) Heatmap depicting expression levels of genes between GFP-positive and negative hMSCs. In total, 2800 genes were differentially expressed between GFP-positive and negative hMSCs. (B) Volcano map of the differentially expressed genes GFP-positive and negative hMSCs. (C) Top 10 enriched signaling pathways analyzed by the KEGG analysis.