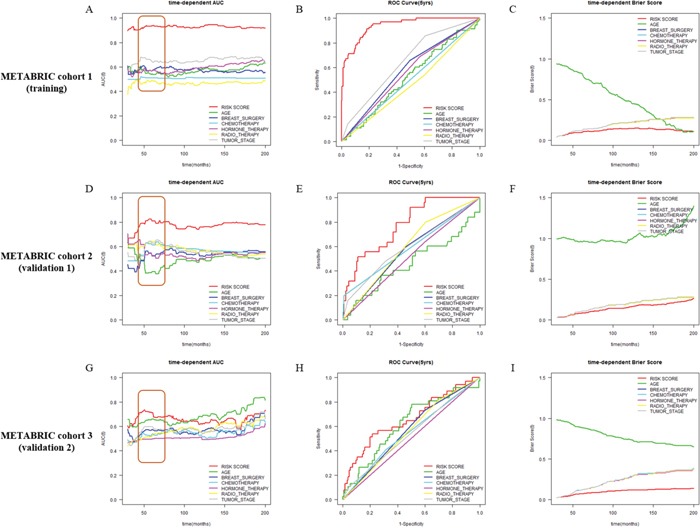
Figure 4. Comparison of discriminative power between Net-score and clinicopathologic variables.

Time-dependent AUC and ROC curve at 5 years in METABRIC cohort 1 (training, A, B and C), METABRIC cohort 2 (validation 1, D, E and F), and METABRIC cohort 3 (validation 2, G, H and I) cohorts according to Net-score and clinical variables (Net-score: red; age: green; breast surgery: blue; chemotherapy: light blue; hormone therapy: pink; radiotherapy: yellow; tumor stage: gray).
