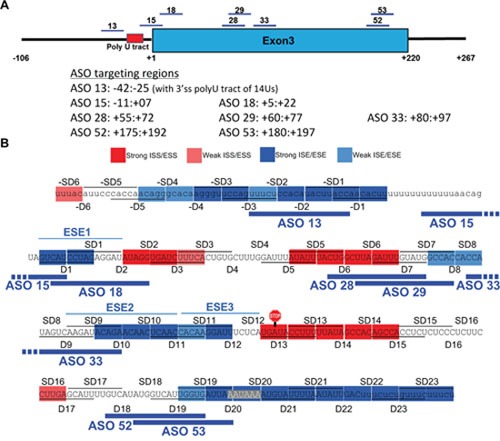
Figure 7. Summary of the map of cis-acting elements and effective splice-switching ASOs for BIM E3 splicing.

(A) Schematic mapping of the shortlisted ASOs which upregulate E4-containing transcripts and increase the imatinib-driven CML cell apoptosis. Their coordinates relative to the first nucleotide of E3 (+1) are also indicated. (B) Overlay of the map of splicing enhancers and silencers by deletion scan with the eight shortlisted ASOs, which mostly target ‘blue’ enhancers or other sequences with similar activity, such as BPS, 3’ss and polyadenylation signal.
