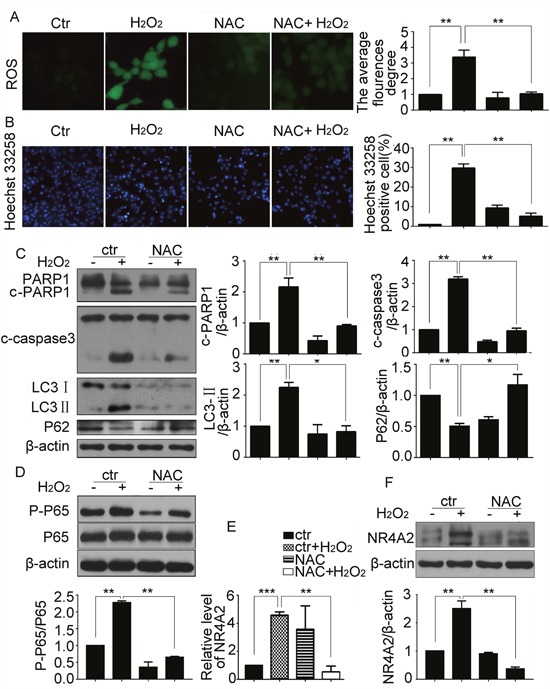
Figure 8. ROS was the upstream of NF-κB/NR4A2 in H2O2-induced autophagy and apoptosis in CSCs.

CSCs were treated with H2O2 (500 μM) in the absence or presence of the antioxidant NAC (0.5 mM) for 5 h. (A) Representative images (× 200) were presented to show ROS levels. (B) Hoechst 33258 staining showed the DNA fragmentation and condensation. Scale bar=20 μM. (C) Western blot results showed changes of cleavage of caspase 3 and PARP1, LC3-II and P62. (D) Western blot showed the changes of phosphorylated P65. (E and F) Changes of NR4A2 levels were detected by qPCR (E) and western blot (F). ctr, control. *P < 0.05; **P < 0.01; n=3.
