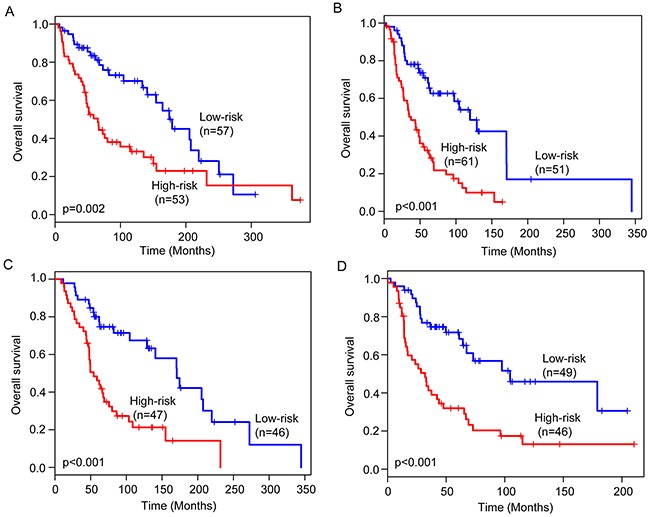
Figure 4. Stratification analysis for age and stage.

Kaplan-Meier survival curves of overall survival between high-risk group and low-risk group for younger patients (A) and elder patients (B). Kaplan-Meier survival curves of overall survival between high-risk group and low-risk group for early-stage patients (C) and advanced-stage patients (D).
