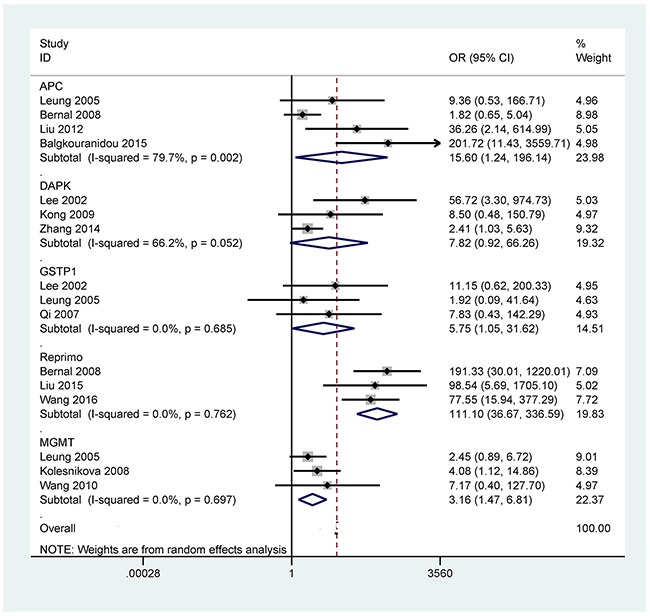
Figure 5. Forest plot of the correlation between APC (OR = 15.60, 95% CI = 1.24-196.14, P = 0.033, methylation frequency (cancer vs control group): 50.6% vs 17.7%), DAPK (OR = 7.82, 95% CI = 0.92-66.26, P = 0.059), GSTP1 (OR = 5.75, 95% CI = 1.05-31.62, P = 0.044, methylation frequency (cancer vs control group): 10.8% vs 0.0%), Reprimo (OR = 111.10, 95% CI = 36.67-336.59, P < 0.001, methylation frequency (cancer vs control group): 82.0% vs 11.0%), and MGMT (OR = 3.16, 95% CI = 1.47-6.81, P = 0.003, methylation frequency (cancer vs control group): 40.9% vs 26.7%) promoter methylation and GC in the blood.

