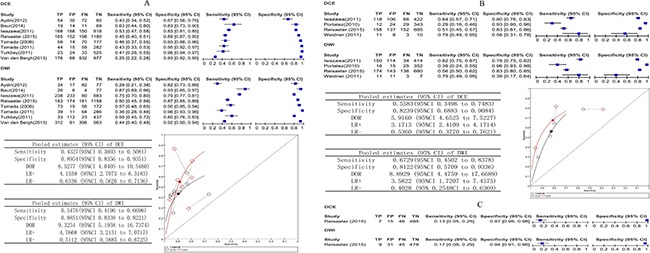
Figure 4.

(A–C) Comparative analysis DCE versus DWI. Dynamic contrast-enhanced MRI compared with DWI biopsy-level analysis: forest plots, pooled estimates and SROC curve showed in whole gland (A) and peripheral zone (B), forest plot showed in transition zone (C).
