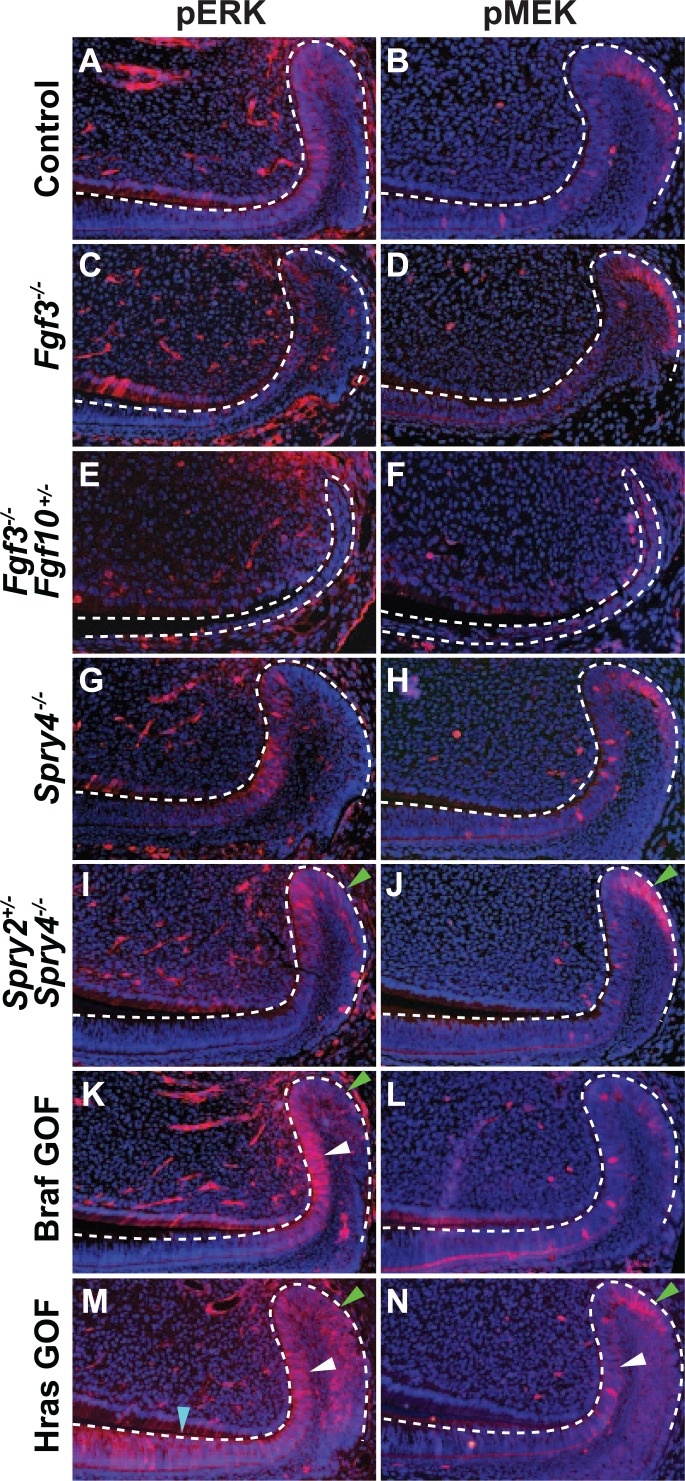
Figure 3.

Phosphorylation of ERK and MEK in the laCL of mouse models with dysregulated RTK signaling. Compared with control (A, B), pERK and pMEK staining was similar in the Fgf3−/− mutant mouse laCL (C, D). In the Fgf3−/−;Fgf10+/− mouse, the levels of ERK and MEK phosphorylation were greatly reduced, and the laCL was small and malformed (E, F). While deletion of Spry4−/− did not noticeably affect pERK and pMEK staining (G, H) compared with control, the Spry2+/−;Spry4−/− mutant showed increased levels of ERK and MEK phosphorylation in the DESC compartment (SR and OEE) as marked by green arrows (I, J). In the BrafL597V gain-of-function mutation (Braf GOF) mouse, pERK staining was increased in the T-A and DESC regions as marked by white and green arrows, respectively, (K) while pMEK staining did not differ significantly (L) compared with control. In HrasG12V gain-of-function mutation (Hras GOF) mutants, phosphorylation of MEK and ERK was increased in the T-A (white arrowhead) and OEE (green arrowhead) regions (M, N) compared with control. pERK staining was also increased in the pre-am region (blue arrowhead; M). DESC, dental epithelial stem cell; laCL, labial cervical loop; OEE, outer enamel epithelium; pre-am, preameloblast; SR, stellate reticulum; T-A, transit-amplifying.
