
Figure 3.
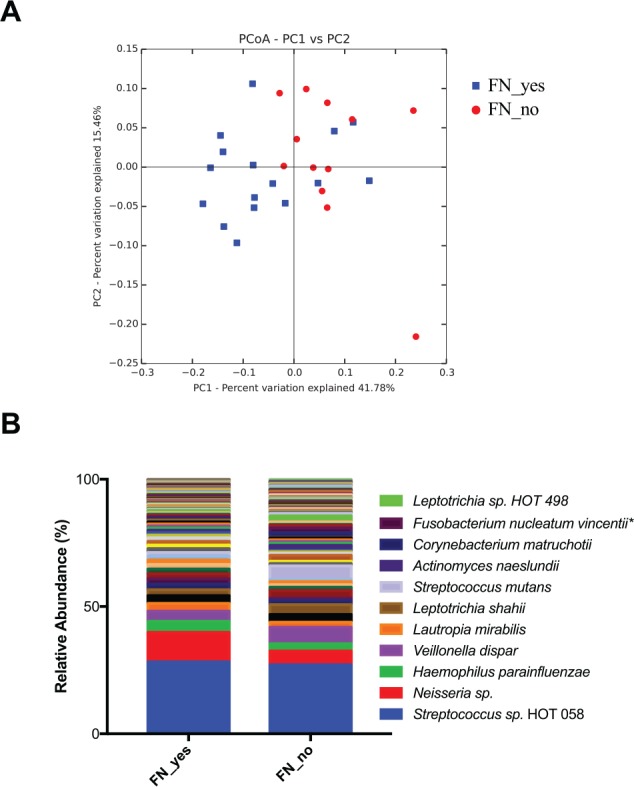
S-ECC subgroup analysis. Subjects from the S-ECC group were further divided per their residency in a First Nations community. (A) Beta diversity shown by principal coordinates analysis (PCoA) of weighted Unifrac distances. The plaque microbial communities significantly clustered by place of residency (P < 0.05, analysis of similarity). Blue, resides in First Nations community; red, does not reside in a First Nations community. (B) Average of the top 100 most abundant species identified in each group. FN_no = does not reside in a First Nations community (n = 13); FN_yes = resides in a First Nations community (n = 17). *P < 0.05 (Kruskal-Wallis with false discovery rate correction). S-ECC, severe early childhood caries.