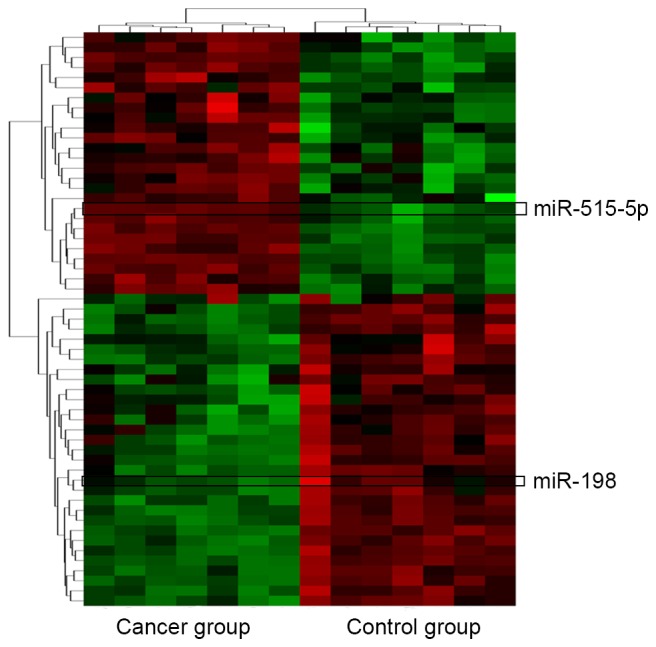
Figure 3.

Bioinformatics analysis. Cluster analysis for the differentially expressed miRNAs between lung adenocarcinoma tissues (cancer group) and adjacent tissues (control group). Sixty-one significant differentially expressed miRNAs (|logFC| >1, adjusted p<0.05) are highlighted in green (downregulation) and red (upregulation).
