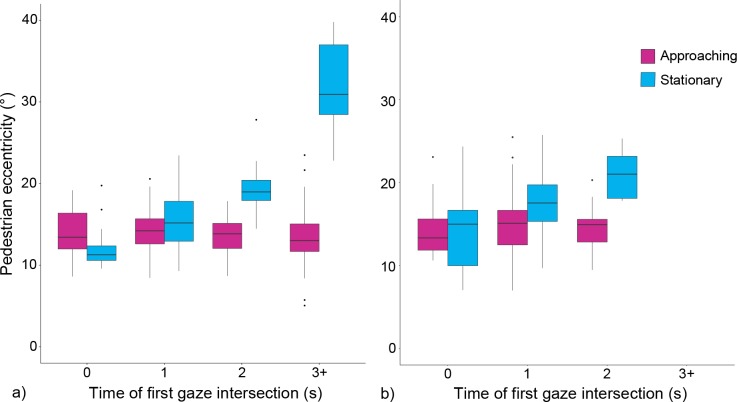
Figure 3.
Boxplots of pedestrian eccentricity at the time of first gaze intersection for all pedestrians that were detected after appearing on (a) the blind side and (b) the seeing side (data pooled across all participants). Pedestrian eccentricity remained approximately constant in the approaching condition but increased rapidly in the stationary condition with increasing time after the pedestrian appearance. Data are grouped in four time bins (Bin 0: <0.5 seconds; Bin 1: 0.5–1.4 seconds; Bin 2: 1.5–2.4 seconds; Bin 3+: ≥2.5 seconds). The thick line in box center represents the median; box length represents the IQR; whiskers represent data within 1.5 times IQR; dots are outlier data points beyond 1.5 times IQR.

