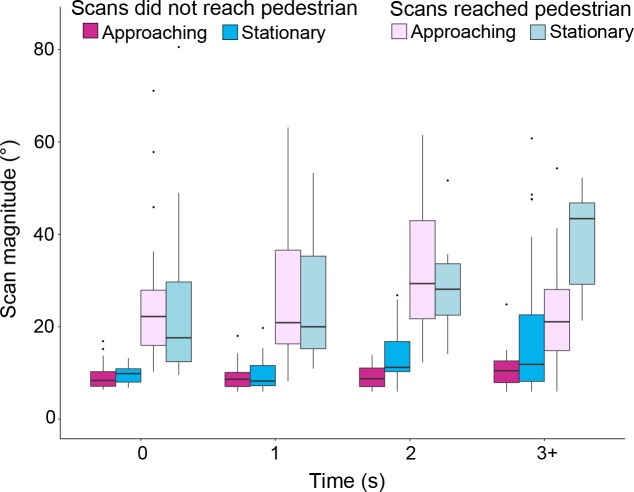
Figure 8.
Boxplots of blind-side scan magnitudes for approaching and stationary pedestrians for scans that reached (detection occurred) and did not reach (detection did not occur) the pedestrian (data pooled across all participants). In the last time bin, the magnitudes of scans that reached and also did not reach the pedestrian were larger in the approaching than the approaching condition reflecting the much greater pedestrian eccentricity in the stationary than the approaching condition at this time point (see the last time bin in Fig. 3). Data are grouped in four time bins (Bin 0: <0.5 seconds; Bin 1: 0.5–1.4 seconds; Bin 2: 1.5–2.4 seconds; Bin 3+: ≥2.5 seconds).

