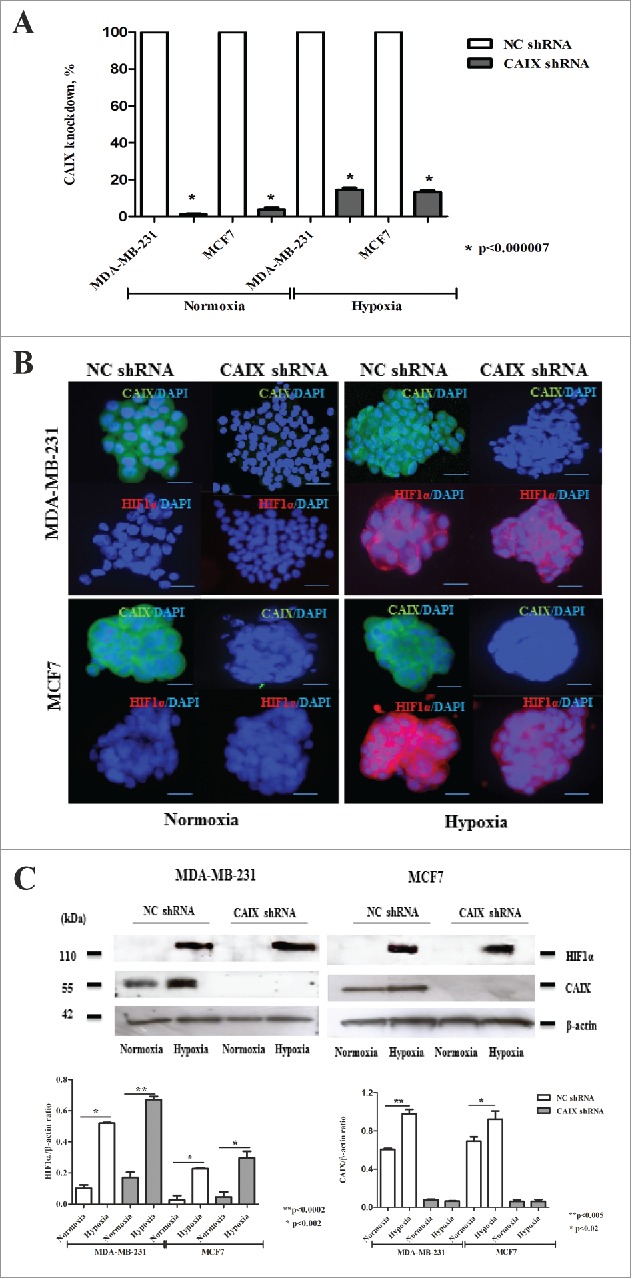
Figure 1.

Verification of CAIX knock-down and exposure to hypoxia in MDA-MB-231 and MCF7 cells. (A) The percent knockdown of CAIX mRNA expression measured by qRT-PCR in MDA-MD-231-shCAIX, MCF7-shCAIX and the respective negative control cells grown at normoxic or hypoxic conditions. (B) Immunofluoresnce and (C) Western blot analysis of CAIX and HIF1α expression in MD-231-shCAIX, MCF7-shCAIX and the respective negative control cells grown as multicellular spheroids in serum-free medium at normoxic or hypoxic conditions. Quantitative analysis of the band intensity normalized to β-actin is shown in the lower panel.
