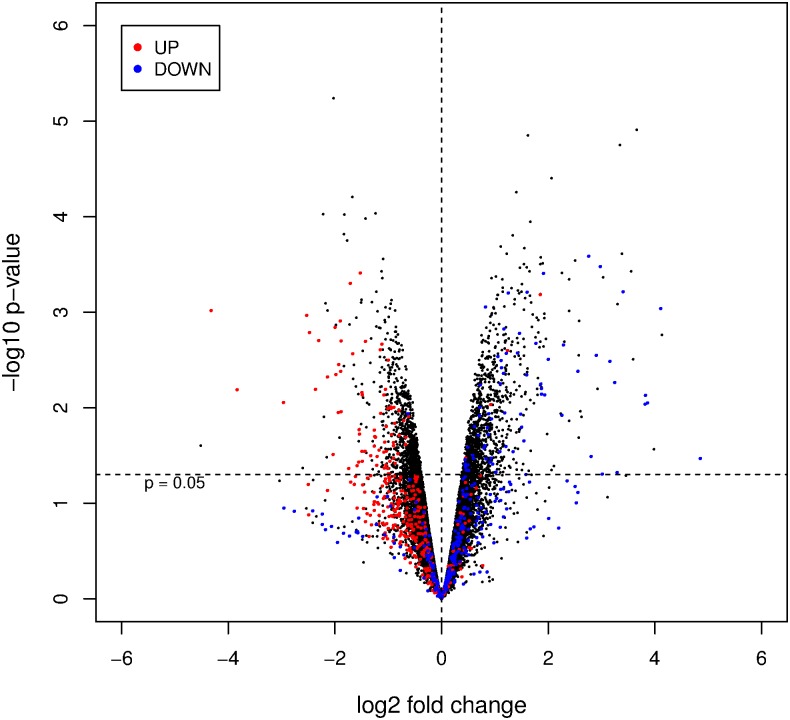
Fig 7. Volcano plot of genes affected by colitis and anti-miR-142-5p treatment.
Volcano plot for the comparison of LNA anti-miR-142-5p treated mice versus scrambled LNA controls. Fold change is indicated on log2-scale on the x-axis, The nominal p-value is indicated on log10-scale on the y-axis. Genes that are regulated in the comparison of transfer-colitic (received CD4+CD45hi cells) mice to non-colitic (received both CD4+CD45hi and lo cells) mice (experiment #1, 3rd time point).

