
Figure 3.
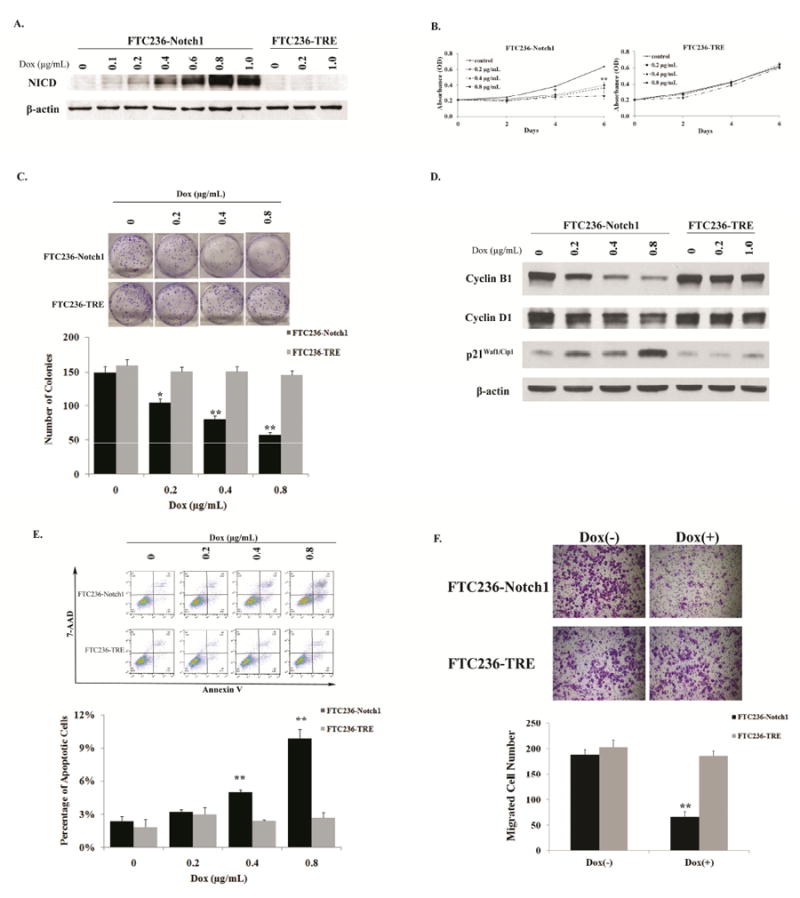
Induction of NICD inhibited DTC cell growth and migration. (A). Whole cell lysate was prepared from both FTC236-Notch1 and FTC236-TRE cells treated with or without doxycycline. The expression level of NICD was analyzed by Western blot; Cell viability of both cell lines with (0-0.8 μg/mL)or without doxycycline treatment was measured by MTT assay (B) and cell proliferation was measured by clonogenic assay (C); (D). Detection of cyclin B1, cyclin D1 and p21Waf1/Cip1 protein expression by Western blot in both FTC236-Notch1 and -TRE cells treated with different concentrations of doxycycline. Equal loading was confirmed with β-actin; (E). Both cell lines were exposed to different concentrations of doxycycline for 48 hours before they were double stained with Annexin V and 7 AAD for flow cytometry analysis. Percentages at right lower quadrant denote the cells in early apoptotic phase. Results of one representative experiment. Data from three repeated experiments are summarized in bar graph; (F). Cell migration was evaluated by a Boyden chamber assay on FTC236-Notch1 and FTC236-TRE with (0.8 μg/mL) or without doxycycline treatment. Histograms show the average cell counts of each cell line with the representative fields of migrated cells on the membrane. Each dot or bar represents mean± SEM; “Dox” indicates doxycycline; * indicates p<0.05 and ** indicates p< 0.01, compared with non-doxycycline treatment groups;Scale bar: 100 μm.