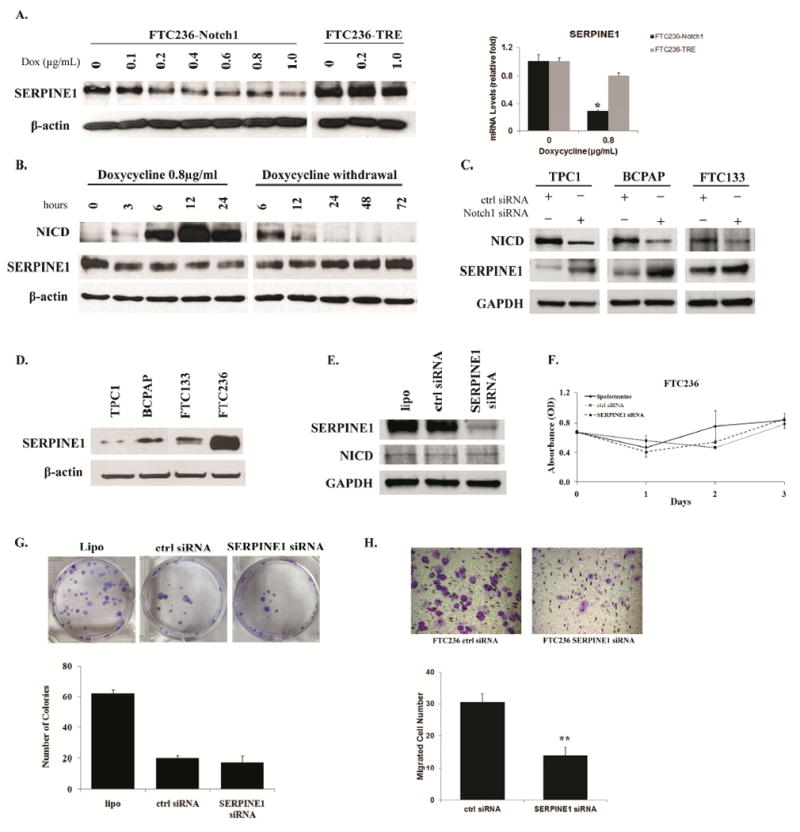
Figure 5.

SERPINE1 was regulated by Notch1 signaling. (A). Both FTC236-Notch1 and FTC236-TRE cells were treated with different concentrations of doxycycline. SERPINE1 levels were measured by Western blot and real-time PCR; (B). Dynamic changes of SERPINE1 levels were detected by Western blot during different time points with or withdrawal NICD induction; (C). NICD and SERPINE1 expression was detected by western blot in TPC1, BCPAP and FTC133 transfected with control siRNA or Notch1 siRNA; (D). The endogenous SERPINE1 expression was evaluated by western blot in four different thyroid cancer cell lines; (E) NICD and SERPINE1 expression was detected by western blot in FTC236 cells transfected with lipofectamine alone, control siRNA or SERPINE1 siRNA; Cell viability of FTC236 transfected with lipofectamine alone, control siRNA or SERPINE1 siRNA was measured by MTT assay (F) while cell proliferation was measured by clonogenic assay (G); (H).FTC236 cells, which showed the highest expression of SERPINE1, were transfected with either SERPINE1 siRNA or control siRNA. Cell migration was measured by Boyden chamber assay. Each bar represents mean± SEM; “Dox” indicates doxycycline; “ctrl” indicates control; “lipo” indicates lipofectamine; * indicates p <0.05; **indicates p <0.01; Scale bar: 50 μm.
