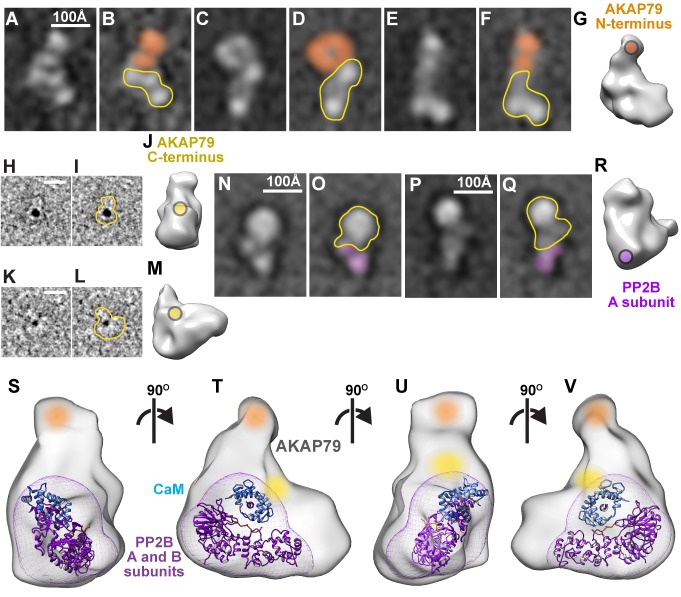
Figure 4. Subunit mapping of AKAP79/PP2B/CaM complexes.
(A–F) Reference-free class averages of AKAP79/PP2B/CaM assemblies complexed with anti-MBP-AKAP79 Fab fragments. Density corresponding to anti-MBP Fab fragment notated with orange. AKAP79/PP2B/CaM complex outlined in yellow (G) 3-dimensional model with anti-MBP Fab binding site indicated in orange. (H, K) Representative Ni-NTA gold-labeled single particle images of AKAP79/PP2B/CaM, 10 Å low-pass filtered for visualization. (I, L) Gold-labeled particle outlines indicated in yellow. (J, M) 3-dimensional models with gold-labeled 10x-His tag indicated in yellow. (N–Q) Reference-free class averages of AKAP79/PP2B/CaM assemblies complexed with anti-Flag-PP2B Fab fragments. Density corresponding to anti-MBP Fab fragment denoted with purple. AKAP79/PP2B/CaM complex outlined in yellow (R) 3-dimensional model with anti-Flag-PP2B Fab binding site indicated in purple. (S–V) 3-dimensional model of active AKAP79/PP2B/CaM complex with subunit labels notated in color and crystal structures of a PP2B (purple)/CaM (blue, PDB: 1YR5) complex docked within the density, views rotated successively around a vertical axis by 90˚. See also Figure 4—video 1.

