. 2017 Oct 12;6:e31307. doi: 10.7554/eLife.31307

Figure 1. Contrast preferences of VG3-AC neurites shift across IPL depths.

(A) Schematic of the VG3-AC circuit. VG3-AC neurites receive input from ON and OFF bipolar cells (ON and OFF BC) and synapse onto RGCs. (B) Ca2+ transients of ROIs at different imaging depth elicited by contrast steps in a small spot (diameter: 100 μm). A bar at the top indicates the stimulus timing. The black trace (shaded area) shows the mean (±SEM) responses of VG3-AC somata (n = 15). The six color-coded traces (shaded areas) indicate the mean (±SEM) responses of neurite ROIs at different IPL depths (21%: n = 673, purple; 29%: n = 972, blue; 37%: n = 817, sky; 44%: n = 1029, green; 51%: n = 1380, lime; 60%: n = 928, olive). (C, D) Distributions (C) and mean ± SEM (D) of polarity indices of VG3-AC neurite ROIs at different IPL depths color-coded as in (B). Polarity indices differed between IPL depths (p<10−16, Kruskal-Wallis one-way ANOVA). ROIs at 21% and 29% IPL depth were more biased to OFF responses than at other depths (p<10−4 compared to 37%; p<10−7 for 44–60%). ROIs from 51–60% IPL depth were more biased to ON than ROIs from 21–44% (p<10−7). No significant differences were observed between 21% and 29% (p=0.99) and between 51% and 60% (p=0.98). Even without image segmentation, using the average activity of each image plane a single data point, polarity indices differed across IPL depths (p<10−12, Kruskal-Wallis one-way ANOVA; 21%: n = 15; 29%: n = 18; 37%: n = 14; 44%: n = 16; 51%: n = 23; 60%: n = 20). (E) Lines show the distributions (i.e. skeleton densities) of axons of different OFF (BC1 – BC4) and ON (BC5t – BC7) bipolar cells types from 15–65% IPL depth, according to (Greene et al., 2016; Helmstaedter et al., 2013) (F) Representative image of a VG3-AC filled with Oregon Green BAPTA-1 via a patch-clamp pipette. (G, H) The average responses (±SEM, G) and polarity index distributions (H) of ROIs of a single VG3-AC at two IPL depths (34%: n = 50, blue; 47%: n = 59, green). (I) Depth-dependent shift in polarity indices (mean ±SEM) of neurite ROIs of two VG3-ACs filled with Oregon Green BAPTA-1 (depth-dependent differences within cells p<10−8 and p<0.05).

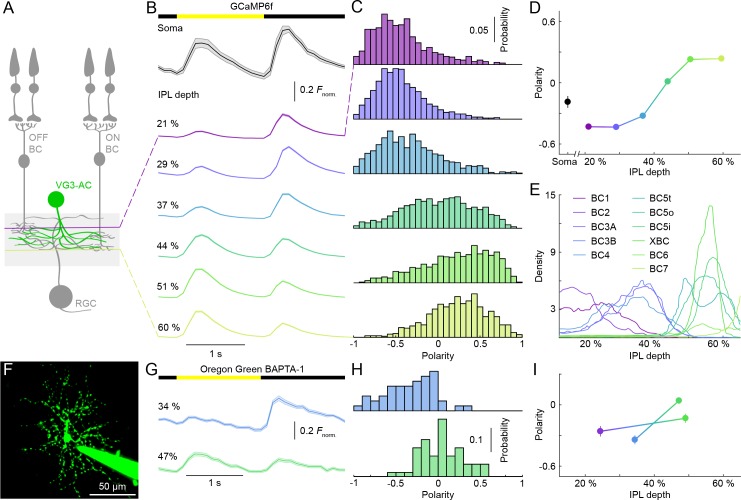
Figure 1.

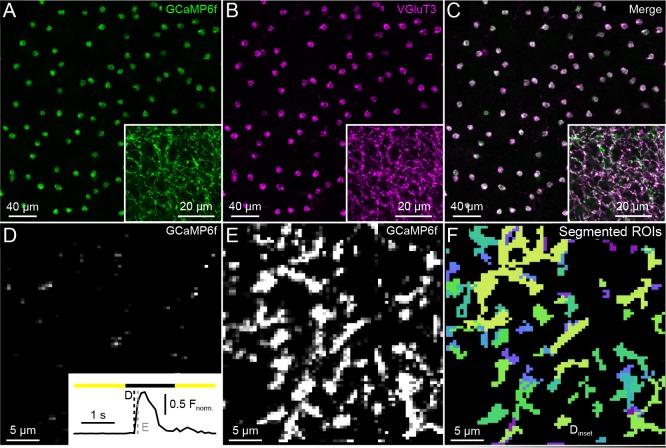
Figure 1—figure supplement 1. Specificity of GCaMP6f expression, VG3-AC neurite Ca2+responses, and functional image segmentation.

Figure 1—figure supplement 1.

(A–C). Representative confocal images of the inner nuclear layer and IPL (insets) stained with anti-GFP, which recognizes GCaMP6f (A, C, green), and anti-VGluT3 (B, C, magenta). Conditional probabilities for co-staining were P(VGluT3-positive | GCaMP6f-positive)=1 (n = 111 cells) and P(GCaMP6f-positive | VGluT3-positive)=0.98 (n = 113 cells). We used optic nerve crush experiments to confirm that sparse off target expression RGCs of VG3-Cre mice did not significantly affect our results (Figure 1—figure supplement 3). (D) Inset: a representative GCaMP6f response trace of an ROI marked in (F), responding to a small spot of light (diameter: 100 μm). (D–E) Frames of a two-photon image series at time points indicated by dashed lines in the inset of (D). (F) Image segmentation of the scan field shown in (D) and (E) by a serial clustering procedure (see Materials and methods).

Figure 1—figure supplement 2. Registration of scan fields of functional GCaMP6f imaging to high-resolution image stacks to identify IPL depth.

Figure 1—figure supplement 2.

(A, B) Each functional imaging scan field of VG3-AC neurites (A), green, 64 × 80 pixels over 33 × 33 µm) was registered to one frame of a high-resolution image stack (B), blue, 512 × 512 pixels over 75 × 75 µm, 0.2 µm / z step) acquired at the end of the functional imaging series. (C) Transmitted laser light was collected during acquisition of the high-resolution stack and used to identify the boundaries of the IPL. Top: transmitted light image of the inner plexiform layer (INL). Bottom: transmitted light image of the ganglion cell layer (GCL).

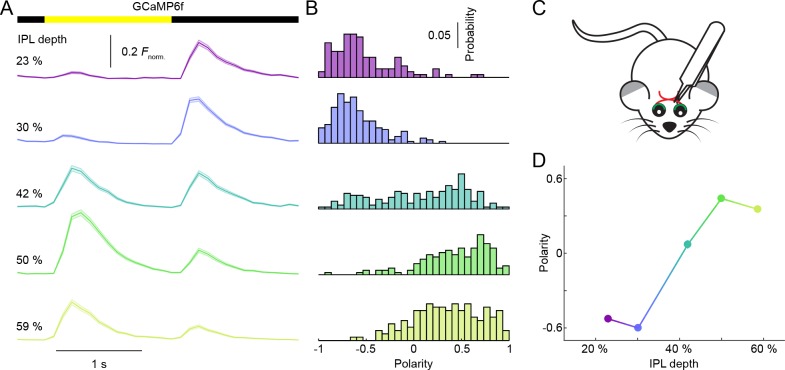
Figure 1—figure supplement 3. Depth-dependent shift in contrast preferences in neurites of VG3-Cre:Ai148 mice 3 weeks after optic nerve crush.

Figure 1—figure supplement 3.

(A) Ca2+ transients of ROIs at different imaging depth to a contrast steps in a small spot (diameter: 100 μm) recorded 3 weeks after optic nerve crush, which removes most RGCs (Park et al., 2008). The somata of VG3-ACs are localized exclusively in the inner nuclear layer; and all cells labeled by GCaMP6f in the ganglion cell layer of VG3-Cre:Ai148 mice have axons, suggesting that they are RGCs. To confirm the loss of RGCs after unilateral optic nerve crush, we compared the number of GCaMP6f-positive somata in the ganglion cell layer of the affected eye 3 weeks after nerve crush, to the number of GCaMP6f-positive somata in the ganglion cell layer of the other eye. This revealed that optic nerve crush reduced the RGC density by 74%. A bar at the top indicates the stimulus timing. The different color-coded traces (shaded areas) indicate the mean (±SEM) responses of ROIs at different IPL depths (23%: n = 120, purple; 30%: n = 203, blue; 42%: n = 178, green; 50%: n = 156, lime; 59%: n = 156, olive). (B) Distributions of polarity indices of VG3-AC neurite ROIs at different IPL depths color-coded as in (A). (C) Schematic of optical nerve crush procedure. (D) Summary data (mean ± SEM) of polarity indices as a function of IPL depth. Polarity indices differed between different IPL depths (p<10−101, Kruskal-Wallis one-way ANOVA). ROIs at 23% and 30% IPL depth were more biased to OFF responses than at other depths (p<10−8 for 41–59%). ROIs from 50–59% IPL depth were more biased to ON responses than ROIs from 23–32% (p<10−8 for 23–30%; p<10−4 for 42%). No significant differences were observed between 23% and 30% (p=0.79) nor between 50% and 59% (p=0.62).