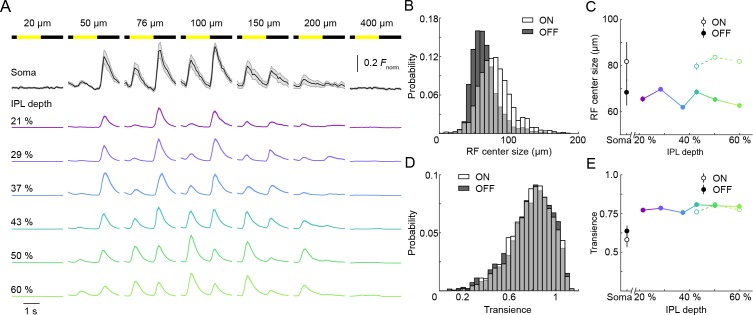
Figure 2. ON and OFF responses in VG3-AC neurites differ in preferred stimulus size, but are equally transient.
(A) Ca2+ responses of ROIs at different imaging depths to contrast steps in spots of different size. Spot diameters are noted above the bars indicating stimulus timing. The black traces (shaded areas) show the mean (±SEM) responses of VG3-AC somata (n = 8). The color-coded traces (shaded areas) indicate the mean (±SEM) responses of ROIs at different IPL depths (21%: n = 306, purple; 29%: n = 456, blue; 37%: n = 336, sky; 43%: n = 367, green; 50%: n = 700, lime; 60%: n = 588, olive). (B) The distributions of ON (white) and OFF (dark gray) receptive field center sizes of VG3-AC neurite ROIs. ON receptive field centers were larger than OFF receptive field centers (p<10−99, Wilcoxon rank sum test) (C) Receptive field center sizes (mean ±SEM) of ON (open circles) and OFF (filled circles) responses as a function of IPL depth. Because small response amplitudes led to rejection of >50% of ON responses of ROIs from 21–37% IPL depth (s. Material and methods), we restrict comparisons to 43–60% IPL depth. At all these depths, ON receptive field center sizes were larger than OFF receptive field center sizes (43%: p<10−8, 50%: p<10−9, 60%: p<10−9, Wilcoxon rank sum test with multiple comparison correction using the Benjamini–Hochberg procedure). Even without image segmentation, using the average activity of each image plane a single data point, ON receptive field centers were larger than OFF receptive field centers (p<10−3, Wilcoxon rank sum test, total: n = 61, 21%: n = 6; 29%: n = 13; 37%: n = 7; 43%: n = 6; 50%: n = 12; 60%: n = 17). (D) The distributions of transience indices of ON (white) and OFF (dark gray) responses of VG3-AC neurite ROIs did not differ significantly (p=0.925, Wilcoxon rank sum test). (E) Summary data (mean ± SEM) of transience indices of ON (open circle) and OFF (filled circle) responses as a function of IPL depth. Due to the high rejection rate of ON responses from 21 to 37% IPL depth, comparisons were restricted to 43–60% IPL depth. Transience indices of ON response is marginally lower than those of OFF responses at 43% (p<0.05), but were not significantly different at 50% (p=0.82) and 60% (p=0.05) IPL depth (Wilcoxon rank sum test with multiple comparison correction using the Benjamini–Hochberg procedure). We are not sure what accounts for the greater response transience observed in VG3-AC neurites vs. somata (p<10−4, Wilcoxon rank sum test). One possibility is that inhibitory synaptic inputs favor neurites and abbreviate responses.


