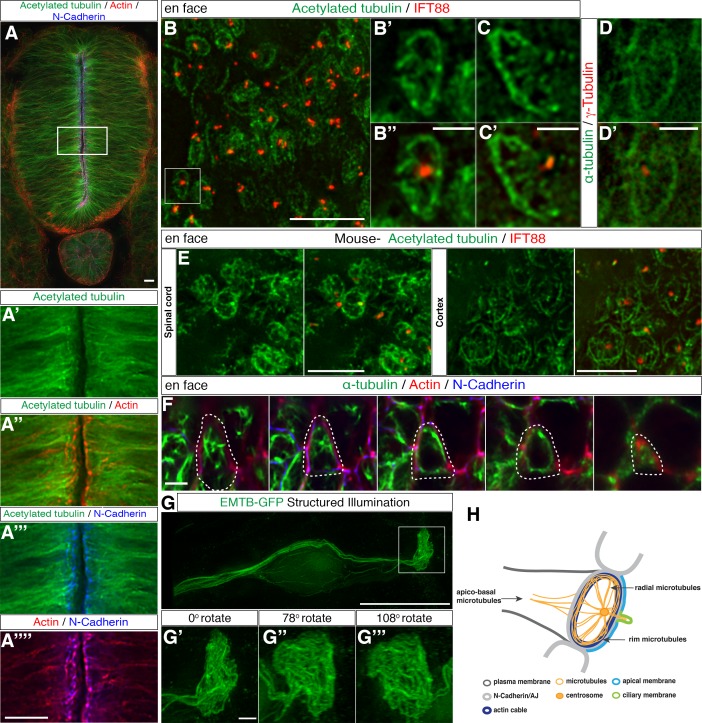
Figure 1. Characterisation of the sub-apical microtubule architecture.
(A) Representative image of a 3-day-old chick embryo neural tube stained with acetylated α-tubulin, phalloidin and N-Cadherin. (A’–A’’’’) Magnification of the boxed region in (A). (B) En face imaging of neuroepithelial end-feet with acetylated α-tubulin and IFT88. (B’–B’’) Magnification of boxed region in (B). (C–C’) Another example as in (B’). (D–D’) End-foot stained with α-tubulin and γ-tubulin. (E) En face imaging of E12.5 mouse embryo spinal cord and cortex stained with acetylated α-tubulin and IFT88. (F) Stills of a neuroepithelial cell (dotted lines show cell outline) en face imaging from apical to more basal (left to right). Tissue explant stained for α-tubulin, N-Cadherin and phalloidin. (G) Neural progenitor cell expressing EMTB-GFP (and nuclear localised GFP from pCIG-Neurog2) imaged with SIM. The boxed region was magnified in (G’–G’’’). Three different angles off the boxed region in G generated by 3D reconstruction. (H) Diagram of microtubule organization at the apical end-feet and relationship with the acto-myosin ring and the AJs. For all figures, images were captured by wide-field microscopy, unless otherwise stated. Scale bars, (A) (B) (E) (G) (A’–A’’’’) 10 μm, (B’–B’’) (C–C’) (D–D’) (F) (G’–G’’’) 2 μm.


