. 2017 Oct 23;6:e26215. doi: 10.7554/eLife.26215

Figure 2. Microtubule dynamics at the apical end-foot and alignment with the actin belt.

(A) Microtubule nucleation from the centrosome. The apical end-foot outline and tracking of EB3-GFP comets over time are shown below. (B) Movement of polymerising microtubules along the actin cable. Lines track movement of two EB3-GFP comets. (C) Microtubules nucleated from the centrosome bend and travel along the actin cable. Lines follow the movement of two EB3-GFP comets. (D) Trail tracking of EB3-GFP comets over time along the F-tractin-mKate2 belt. Three timepoints are shown. The arrowhead represents the starting point of EB3-GFP comet movement. The yellow line shows its position at different timepoints and the method for the measurement of fluorescence intensity at that particular point for both channels. (E) Example of fitted Guassian curves for the calculation of inter-peak distance between the two channels. For the purpose of this example, both fitted fluorescence intensity calculations were normalised from 0 to 1. (F) Box-plots of the microtubule (EB3-GFP)- actin (F-tractin-mKate2) inter-peak distance over time (paired t-test: tp 1 vs tp 2, p=0.84; tp 2 vs tp 3, p=0.72; tp 1 vs tp 3, p=0.96). Scale bars, (A) (B) (C) 2 μm.

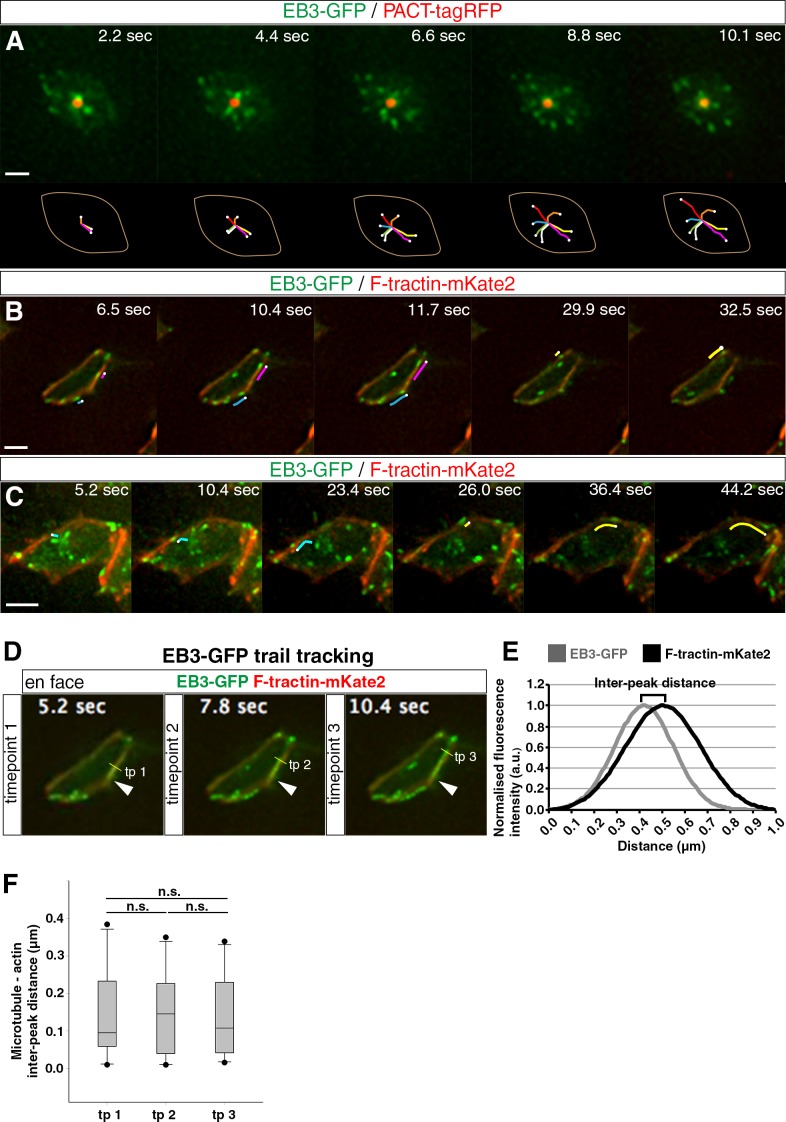
Figure 2—source data 1. EB3-GFP_F-tractin-mKate2 inter-peak distance.
elife-26215-fig2-data1.xlsx (109.7KB, xlsx)
DOI: 10.7554/eLife.26215.009

Figure 2.

Figure 2—video 1. Microtubule nucleation from the apical centrosome; this video is related to Figure 2A.
Download video file (72.3KB, mp4)
DOI: 10.7554/eLife.26215.010
Mis-expressed PACT-TagRFP labels the centrosome and EB3-GFP the growing tips of polymerising microtubules. Maximum intensity projections of deconvolved image sequences are used. Images acquired every 2.2 s. 
Figure 2—video 2. Microtubule movement along the actin cable; this video is related to Figure 2B.
Download video file (293.6KB, mp4)
DOI: 10.7554/eLife.26215.011
Mis-expressed F-tractin-mKate2 labels the actin cable and EB3-GFP the growing tips of polymerising microtubules. Maximum intensity projections of deconvolved image sequences are used. Images acquired every 2.6 s. 
Figure 2—video 3. Trail tracking of EB3-GFP comets; this video is related to Figure 2—video 2 and Figure 2D.
Download video file (62.5KB, mp4)
DOI: 10.7554/eLife.26215.012
As in Figure 2—video 2. The whole imaging area is represented to the left. To the right a single end foot is selected and magnified, with actin and EB3 channels (top) and only GFP (bottom) Images acquired every 2.6 s.
Figure 2—video 4. Microtubule bending at the actin cable; this video is related to Figure 2C.
Download video file (241.3KB, mp4)
DOI: 10.7554/eLife.26215.013
Mis-expressed F-tractin-mKate2 labels the actin cable and EB3-GFP the growing tips of polymerising microtubules. Maximum intensity projections of deconvolved image sequences are used. Images acquired every 2.6 s.