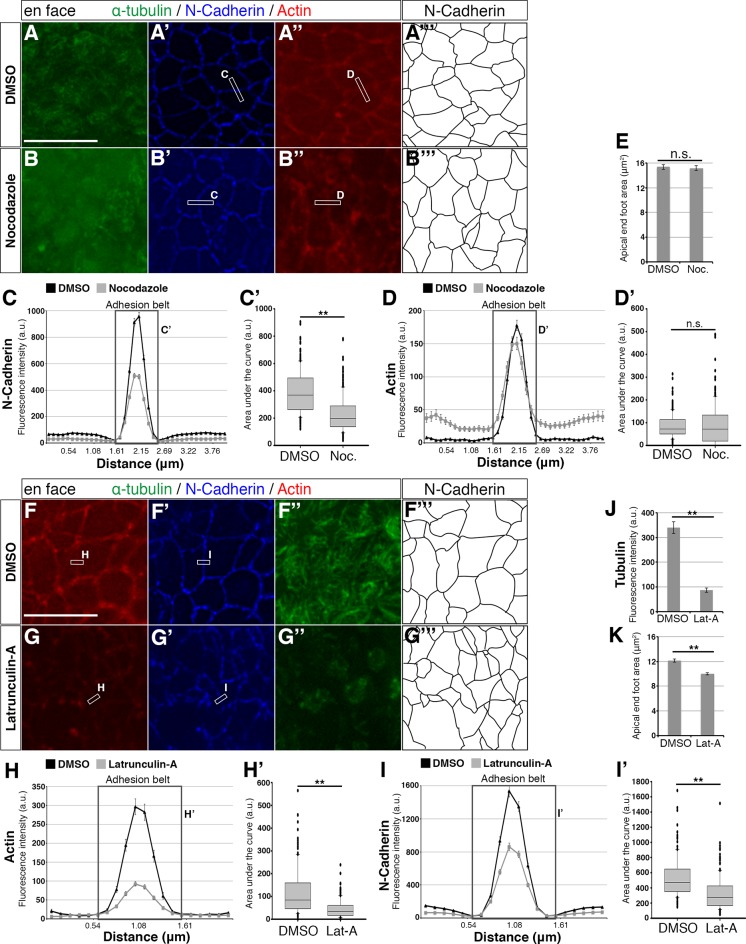
Figure 3. Effects of small molecule treatments on the adhesion belt and microtubules.
(A – A’’, B – B’’, F – F’’, G – G’’) En face imaging of apical end-feet following treatment of chick embryo neural tube explants with Nocodazole (Noc) or Latruncuin-A (Lat-A). Boxed areas indicate how a line is drawn across the adhesion belt for measurement of fluorescence intensity. Letters next to the boxes refer to the corresponding line graphs. (C, D, H, I) Line graphs of normalised fluorescence intensity across the adhesion belt. For Nocodazole a distance of 4 μm and for Latrunculin-A 2 μm was measured. Boxed area represents the adhesion belt and the letter refers to the box plot quantifications from that area. Error bars = SEM. (C’, D’, H’, I’) Box plots of the area under the curve (adhesion belt) from the line graphs. The median value, as well as the upper and lower quartiles are represented. T-test, (C’) p<0.0001 (DMSO [Nocodazole control]: 210 measurements, 6 explants in 3 experiments; Nocodazole: 270 measurements, 8 explants in 3 experiments), (D’) p=0.51 (DMSO [Nocodazole control]: 180 measurements, 6 explants in 3 experiments; Nocodazole: 244 measurements, 8 explants in 3 experiments), (H’) p<0.0001 (DMSO [Latrunculin-A control]: 140 measurements, 5 explants in 2 experiments; Latrunculin-A: 213 measurements, 7 explants in 3 experiments) and (I’) p<0.0001 (DMSO [Latrunculin-A control]: 140 measurements, 5 explants in 2 experiments; Latrunculin-A: 213 measurements, 7 explants in 3 experiments). When the entire curve is considered in (D), the area of the Nocodazole treatment is statistically larger than that of the DMSO treatment, p<0.0001. (E, K) End-foot area measurements for DMSO and small molecule treatments, as outlined by the N-Cadherin staining (A’’’, B’’’, F’’’, G’’’). T-test, (E) p=0.73 (DMSO [Nocodazole control]: 276 measurements in 3 experiments; Nocodazole: 304 measurements in 3 experiments) and (K) p<0.0001 (DMSO [Latrunculin-A control]: 222 measurements in two experiments; Latrunculin-A: 334 measurements in 3 experiments). Error bars = SEM. (J) Normalised tubulin fluorescence following DMSO or Latrunculin-A treatment. T-test, p<0.0001 (DMSO: 110 measurements in 2 experiments; Latrunculin-A: 205 measurements in 3 experiments). Error bars = SEM, scale bars, 10 μm.

