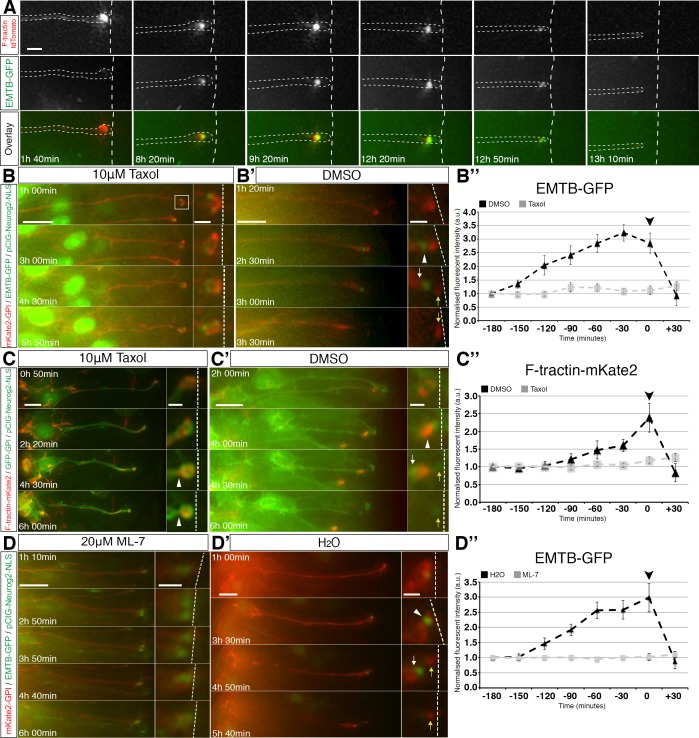
Figure 6. Coordination of sub-apical actin and microtubule dynamics.
(A) Live imaging of sub-apical actin (F-tractin td-Tomato) and microtubule (EMTB-GFP) dynamics during apical abscission. (B–B’, C–C’, D–D’). Time-lapse sequences of neural tube in embryo slices electroporated with EMTB-GFP/pCIG-Neurog2/mKate2 GPI or F-tractin-mKate2/pCIG-Neurog2/GFP GPI and treated with taxol (B, C) or ML-7 (D) or control vehicle (B’, C’, D’). Abscission site (white arrowheads), withdrawing apical process (white arrows), abscised particle (yellow arrows) and apical side (white dashed line) (B’’, C’’, D’’) Line graphs of normalised fluorescence intensities of EMTB-GFP or F-tractin-mKate2 dynamics in taxol or ML-7 (grey dashed line) and their control vehicles (black dashed line), quantified for 3 hr 30 min at 30 min intervals. EMTB-GFP dynamics are significantly affected by the taxol and ML-7 treatment (2-way ANOVA, p<0.001 for each of the treatments, error bars = SEM). F-tractin-mKate2 dynamics are significantly affected by ML-7 treatment (2-way ANOVA, p=0.002, error bars = SEM). Black arrowhead is abscission point for controls. Scale bars, (A) 2 μm, (B–B’) (C–C’) (D–D’) 10 μm; enlarged regions, 2 μm.Figure

