. 2017 Oct 23;6:e26215. doi: 10.7554/eLife.26215

Figure 7. Drebrin localisation in the neural tube.

(A) Representative image of HH17-18 chick embryo neural tube labelled with antibodies to detect drebrin and acetylated α-tubulin and stained with phalloidin. Magnified boxed region shown in A'-A'''. End-foot of a neuroepithelial cell mis-expressing (B) Drebrin-mCherry and (B') EMTB-GFP and stained with (B'') phalloidin. (C) Representative line graphs of normalised fluorescence intensity at the level of the actin cable (B–B''). (D) En face imaging of neuroepithelial end-feet electroporated with Drebrin-YFP and stained for phalloidin. Boxed areas are magnified. White arrowheads indicate Drebrin-YFP and phalloidin co-localisation. Scale bars, (A) 20 μm and boxed region 5 μm, (B) 2 μm, (C) 10 μm.

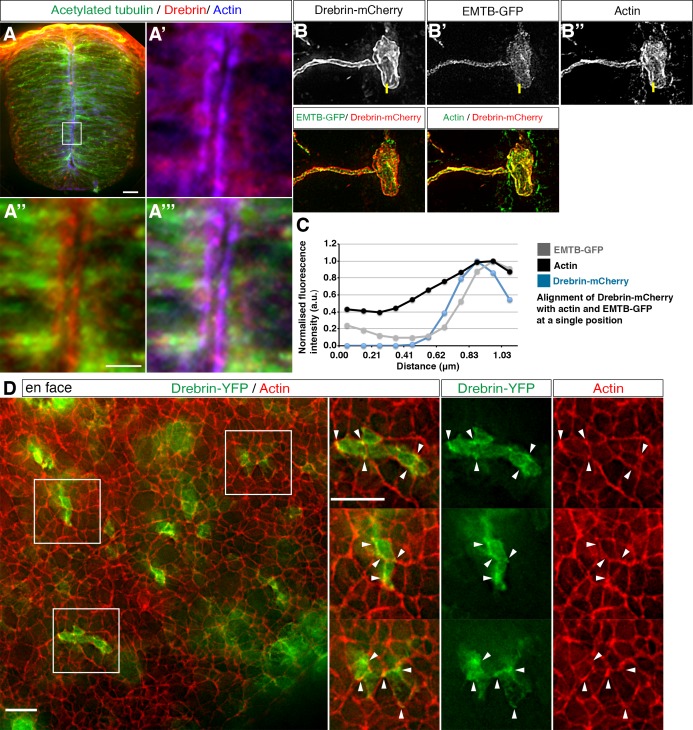
Figure 7—source data 1. Drebrin-mCherry / Actin / EMTB-GFP alignment.
elife-26215-fig7-data1.xlsx (151.5KB, xlsx)
DOI: 10.7554/eLife.26215.044

Figure 7.

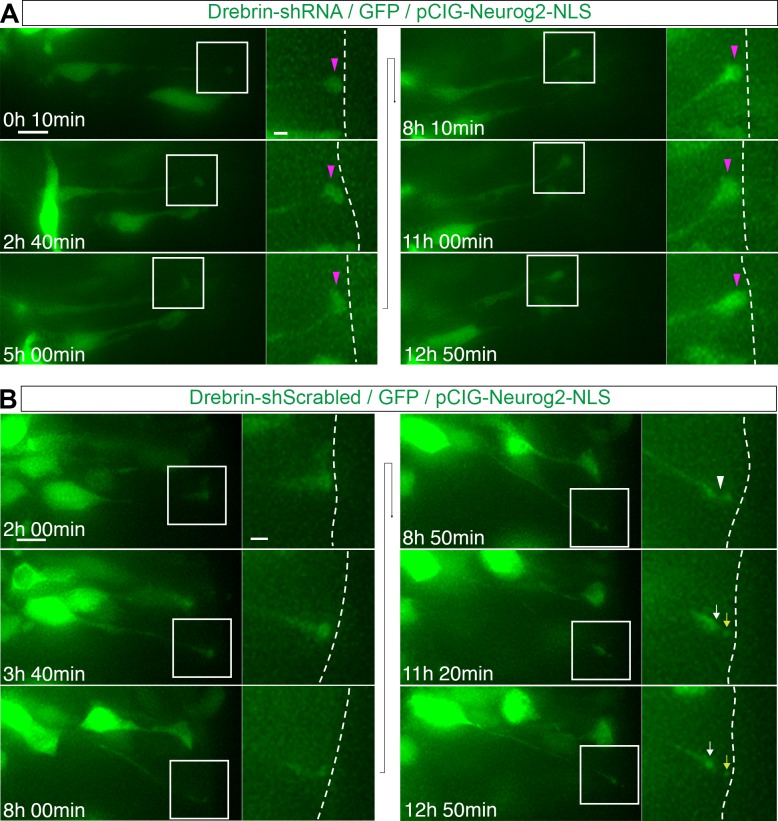
Figure 7—figure supplement 1. Drebrin knockdown reduces the incidence of delamination.

Figure 7—figure supplement 1.

(A) Time lapse sequence of a cell mis-expressing Drebrin-shRNA (green) and pCIG-Neurog2 (nuclear, green). (B) Time lapse sequence of a cell mis-expressing Drebrin-shScrambled (green) and pCIG-Neurog2 (nuclear, green). Apical end process (purple arrowhead), abscission site (white arrowheads), withdrawing apical process (white arrows), abscised particle (yellow arrows) and apical side (white dashed line). Scale bars, 10 μm; enlarged regions, 2 μm.
Figure 7—video 1. Time-lapse sequence of cell behaviour following Drebrin knockdow; this video is related to Figure 7—figure supplement 1A.
Download video file (181.5KB, mp4)
DOI: 10.7554/eLife.26215.045
Neuronal delamination is promoted by the mis-expression of Neurog2 (pCIG-Neurog2) that labels the nucleus (green), GFP expression from the Drebrin-shRNA construct labels the cytoplasm (green). Maximum intensity projections of deconvolved images were used. Images acquired every 10 min. 
Figure 7—video 2. Time-lapse sequence of cell behaviour following scrambled shRNA construct expression; this video is related to Figure 7—figure supplement 1B.
Download video file (212.4KB, mp4)
DOI: 10.7554/eLife.26215.046
Apical abscission is promoted by the mis-expression of Neurog2 (pCIG-Neurog2) that labels the nucleus (green), Drebrin-shScrambled labels the cytoplasm (green). Maximum intensity projections of deconvolved images were used. Images acquired every 10 min.