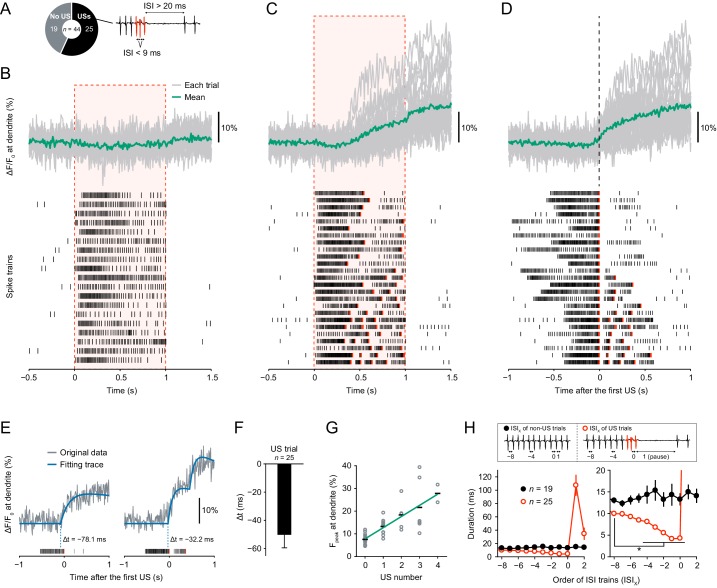
Figure 1. Dendritic Ca2+ transients precede unconventional spikes.
Dual recordings of Ca2+ dynamics and extracellular membrane potential in Class IV neurons expressing GCaMP5G. A 44 mW IR laser was focused onto the proximal dendritic arbors in filet preparations for 1 s (red-dashed boxes in B and C). (A) Pie chart of recordings (total n = 44 cells). To the right, the example illustrates the definition of unconventional spikes (USs, an index of the burst-and-pause firing patterns) as follows: (i) The first and second ISIs of four sequential spikes are less than 9 ms. (ii) The third ISI is longer than 20 ms. Here, sets of the three spikes except for the last one are designated as USs. (B–D) Time courses of Ca2+ levels at distal dendrites (top) and spike trains (bottom). Data are classified into trials without USs (B) and with USs (C–D). Gray lines indicate dendritic Ca2+ transients from each cell, and the green line represents the averaged amplitude. Red raster lines indicate USs. (B) Trials without USs did not generate Ca2+ transients (n = 19 cells; ΔF/F0 = 0.52 ± 0.87%, mean ± s.e.m. after laser irradiation). (C) Trials with USs generated Ca2+ transients (n = 25 cells; ΔF/F0 = 9.33 ± 1.57%, mean ± s.e.m. after laser irradiation). The first USs occurred at 0.55 ± 0.04 s (mean ± s.e.m.). (D)Data (C) are aligned at the first-US end timings. The onset of the increase in Ca2+ levels approximately coincided with the first-US timings. (E)Representative time course of Ca2+ transients (gray) and the fitting traces (blue). The onset of Ca2+ transients actually preceded the first-US timings, and the Ca2+ transients with multiple USs were stepwise (right). (F) Temporal differences between the onset of Ca2+ transients and the first-US timings. The former occurred earlier than the latter (Δt = − 50.3 ± 9.2 ms, mean ± s.e.m.). (G) Amplitudes of Fpeak are plotted against total US numbers for each trial. Short black bars indicate the averages of Fpeak, and the green line is a linear regression of plotted data (p=1.0 × 10⁻¹¹, rho = 0.82, Spearman’s rank correlation test). (H) Time course of ISIs. X of ISIX indicates the order of ISIs: (black) ISI−8–ISI2 are the minimum ISI trains of non-US trials in Figure 1B. (red) ISI0 indicates the ISIs of the first-US end, and ISI1 represents the pause periods in Figure 1C. At the right, the y-axis was magnified to show that ISIs became shorter before the occurrence of the pause (mean ± s.e.m.; *p<0.05, paired-sample t-test with Bonferroni correction).


