. 2017 Oct 16;6:e29754. doi: 10.7554/eLife.29754

Figure 2. Electrophysiological screen of Cl and K+ channels.

(A–C) Cl dynamics of Class IV neurons expressing SuperClomeleon. The IR laser (30 and 46 mW) was focused onto the proximal dendritic arbors in whole-mount preparations for 1 s (red-dashed boxes in B). (A) A schematic diagram of Cl indicator SuperClomeleon. The FRET ratio decreases upon an influx of Cl, due to quenching of YFP fluorescence by reversible Cl binding. Left is a representative CFP image before IR-laser irradiation. (B) Time courses of the FRET ratio at somata (left) and distal dendrites (right) in wild-type neurons. Both of them increased upon IR-laser irradiation. Gray lines indicate each of the Cl changes, and black lines represent the averaged amplitudes. The apparent efflux of Cl ions was unexpected. (C) Amplitudes of ΔRpeak of SuperClomeleon increased with IR-laser power (mean ± s.e.m.; ***p<0.001, Student’s t-test). (D–F) Responses of screened neurons expressing the Ca2+ indicator TN-XXL. The 48 mW IR laser was focused onto the proximal dendritic arbors in filet preparations for 1 s (red-dashed box in D). **p<0.05, ***p<0.01 versus control. (D) Representative recordings of control, Ca-α1D (L-type VGCC α1 subunit gene) RNAi and K+ channel-coding gene (Shaker, Shal, SK, Irk2 and Task7) RNAi neurons. (E) Boxplot of the total US number in screened neurons. The US number increased in five different gene knockdown neurons (Sh, Shal, SK, Irk2 and Task7; Wilcoxon rank sum test). (F) Amplitudes of the dendritic Ca2+ transients in screened channels. The amplitudes did not decrease except for Ca-α1D RNAi neurons (mean ± s.e.m.; Student’s t-test). Bottom horizontal labels indicate symbols of knocked down genes and upper labels represent channel families: Kv, voltage-gated K+ channel; KCa, Ca2+-activated K+ channel; Kir, Inward rectifier K+ channel; K2P, Two-pore domain K+ channel.

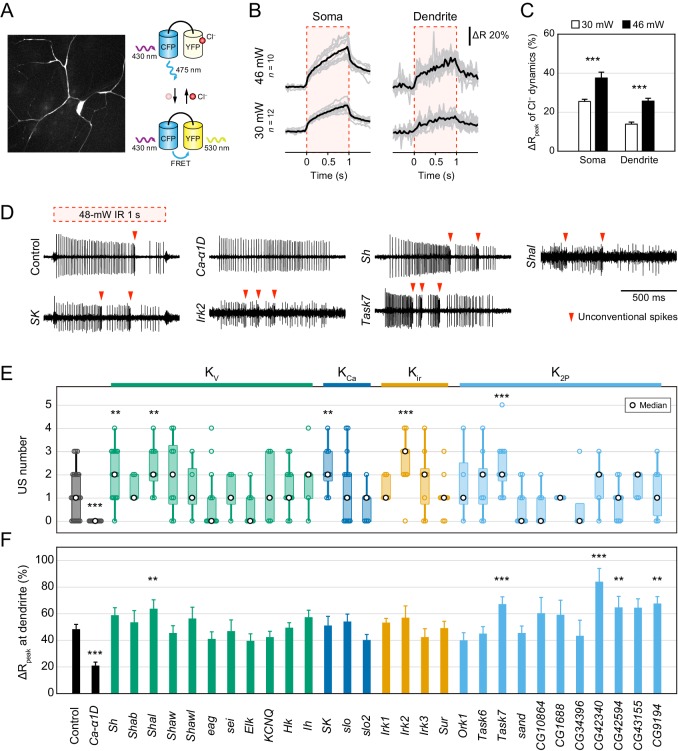
Figure 2—source data 1. Twenty-Nine K+ channels were screened.
w was a negative control and Ca-α1D was a positive control whose knockdown abolished burst-and-pause firing patterns.
DOI: 10.7554/eLife.29754.009
Figure 2—source data 2. Source data for Figure 2.
DOI: 10.7554/eLife.29754.010
Figure 2—source data 3. Source data for Figure 2—figure supplement 1.
DOI: 10.7554/eLife.29754.011
Figure 2—source data 4. Source data for Figure 2—figure supplement 2.
DOI: 10.7554/eLife.29754.012

Figure 2.

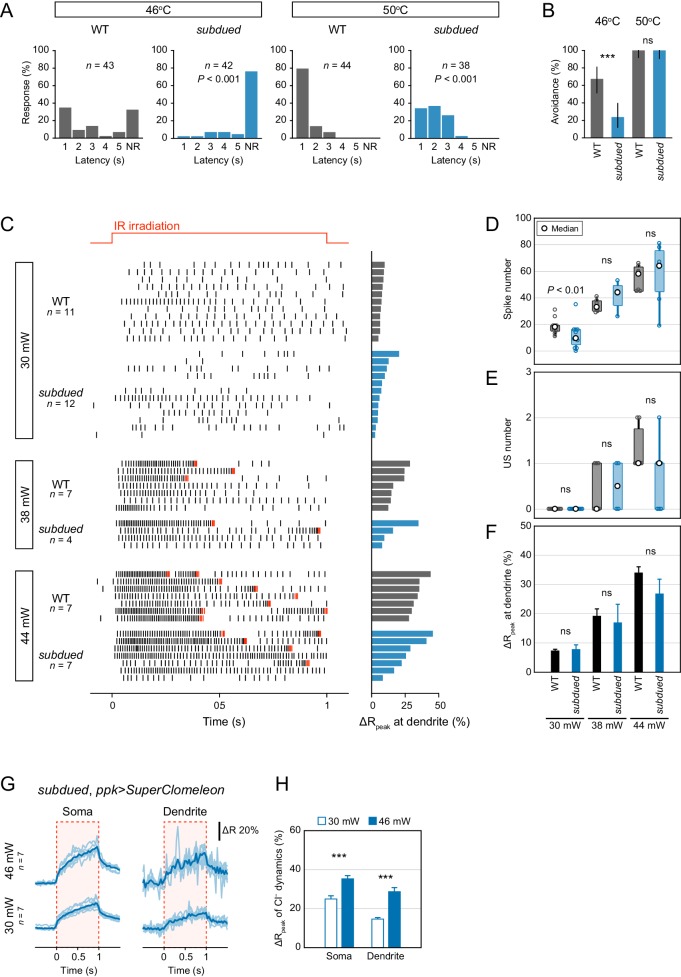
Figure 2—figure supplement 1. Behavioral and electrophysiological analysis of subdued mutants.

Figure 2—figure supplement 1.

The gating property of subdued channels is dependent on heat, voltage and Ca2+, and the expression in Class IV neuron is required for larval heat avoidance behavior (Jang et al., 2015). Considering the results of the Cl ion direction (Figure 2B–C), the possibility of subdued channels contributing to inhibitory currents is low, although an effect of the Subdued channels on neuronal activity cannot be completely excluded. (see below). (A–B) Avoidance behavior of wild-type and subdued mutant larvae expressing TN-XXL in response to thermal stimulation (46°C and 50°C). The onsets of avoidance behavior were delayed at both temperatures, and the fraction of no response was increased in mutant larvae at 46°C. (A) The distribution of response latency (Wilcoxon rank sum test). NR, no response group. (B) Percentage of larvae responding within 5 s with 95% Clopper-Pearson confidence intervals (Fisher’s exact test). (C–F) Responses of wild-type and subdued mutant neurons expressing TN-XXL with different IR-laser power (30, 38 and 44 mW). The IR laser was focused onto the proximal dendritic arbors in filet preparations for 1 s (upper red line in C). (C) Raster plots of firing (left) and magnitudes of the ΔRpeak corresponding to dendritic Ca2+ transients (right). Trials are sorted by descending order of the magnitude of the ΔRpeak. Red raster lines indicate USs. (D) Spike numbers decreased in subdued mutant neurons only at low IR-laser power (30 mW; boxplot; Student’s t-test). (E–F) subdued mutant neurons did not significantly change the number of USs (E; boxplot, Wilcoxon rank sum test) or the amplitudes of the dendritic Ca2+ transients (F; mean ± s.e.m., Student’s t-test). (G–H) Cl dynamics of subdued mutant neurons expressing SuperClomeleon. The IR laser (30 and 46 mW) was focused onto the proximal dendritic arbors in whole-mount preparations for 1 s (red-dashed boxes in G). (G) Time courses of the FRET ratio of SuperClomeleon at somata (left) and distal dendrites (right) in subdued mutant neurons. The ratio increased upon IR irradiation. Light blue lines indicate each of the Cl changes, and dark lines represent the averaged amplitudes. (H) Amplitudes of the ΔRpeak for SuperClomeleon increased with IR-laser power in subdued mutant neurons (mean ± s.e.m., Student’s t-test), but they were not significantly different from the values obtained for wild-type neurons in Figure 2C. Furthermore, there were no changes in physiological activities in subdued knockdown neurons (data not shown). These results suggested that Subdued channels can contribute to membrane excitation in Class IV neurons, although their function may be rather limited; in any case, the channels were not a source of inhibitory currents. *p<0.05, **p<0.01, ***p<0.001.
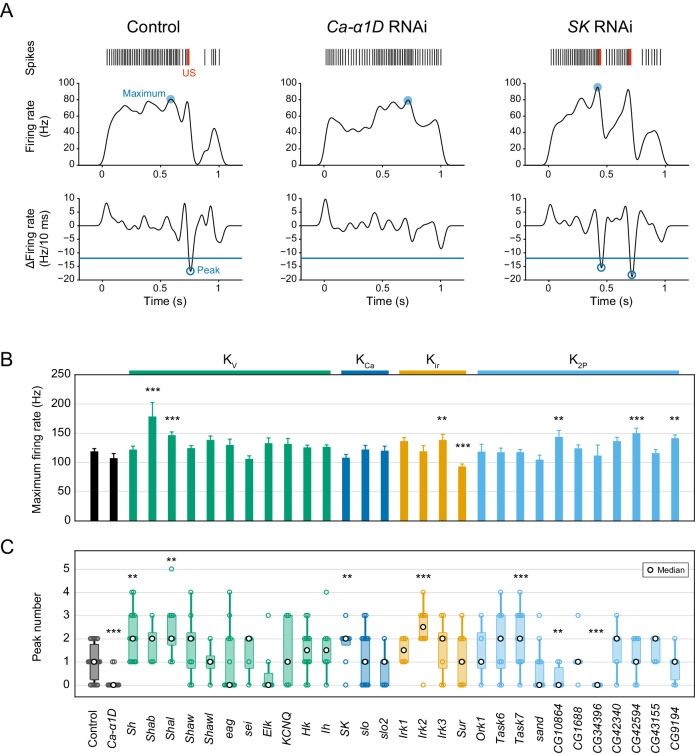
Figure 2—figure supplement 2. Quantification of the maximum firing rate and the peak number.

Figure 2—figure supplement 2.

(A) Representative traces of control, Ca-α1D, and SK RNAi neurons. Firing rates (middle) were computed from spike trains (top) by Gaussian kernel methods (σ = 25 ms; Shimazaki and Shinomoto, 2010). The temporal differences in the firing rate were calculated (bottom, per 10 ms), and peaks of the time derivative were specified below a threshold (−12 Hz/10 ms) where the firing rate decreased by 60 Hz for 50 ms. The local minimum was more closely matched to detect burst-and-pause firing patterns than the local maximum that was used in our previous work (Terada et al., 2016). (B) Bar plots of the maximum firing rates in screened neurons (mean ± s.e.m., Student’s t-test). (C) Boxplots of the peak numbers in screened neurons. The peak number increased in five different gene knockdown neurons (Sh, Shal, SK, Irk2 and Task7; Wilcoxon rank sum test). Bottom horizontal labels indicate symbols of knocked down genes and upper labels indicate channel families: Kv, voltage-gated K+ channel; KCa, Ca2+-activated K+ channel; Kir, Inward rectifier K+ channel; K2P, Two-pore domain K+ channel. **p<0.05, ***p<0.01 versus control.