. 2017 Oct 16;6:e29754. doi: 10.7554/eLife.29754

Figure 3. SK channels generate pause periods.

(A–E) Responses of two control neurons (ppk-Gal4 and UAS-SK RNAiHMJ21196) and SK knockdown neurons (ppk>SK RNAiHMJ21196) with different IR-laser power settings (36, 40 and 48 mW). The IR laser was focused onto the proximal dendritic arbors in filet preparations for 1 s. (A)Raster plots of firing (left) and magnitudes of the ΔRpeak corresponding to dendritic Ca2+ transients (right). Trials are sorted in descending order of the magnitude of the ΔRpeak. Red raster lines indicate USs. (B–D) SK knockdown neurons increased the US number, peak number (B and C; boxplots; Wilcoxon rank sum test with Holm correction), and amplitude of the dendritic Ca2+ transients (D; mean ± s.e.m.; Student’s t-test with Holm correction) with three different laser powers. (E) Boxplots of the pause periods triggered by the 48 mW IR laser. Pause periods were shortened in SK knockdown neurons (median: [ppk-Gal4] 103.9 ms (n = 14), [UAS-SK RNAi] 112.9 ms (n = 21), [ppk >SK RNAi] 46.75 ms (n = 34); Student’s t-test with Holm correction). (F–G) Avoidance behavior of two control larvae and SK knockdown larvae in response to thermal stimulation (42, 44, and 46°C). (F) The distribution of response latency. SK knockdown larvae displayed fast onsets of responses upon moderate stimulation (44°C; median: [ppk-Gal4] 3.80 s, [UAS-SK RNAi] 4.86 s, [ppk>SK RNAi] 1.80 s; Wilcoxon rank sum test with Holm correction). Neither control nor SK knockdown larvae showed avoidance behavior upon lower stimulation (42°C), whereas most of the larvae displayed it with higher stimulation (46°C). NR, no response group. ‘a’ is a P value versus ppk-Gal4, and ‘b’ is that versus UAS-SK RNAi. (G) Percentage of larvae responding within 5 s with 95% Clopper-Pearson confidence intervals. The response rate of SK knockdown larvae increased upon moderate stimulation (44°C: [ppk-Gal4] 56.9%, [UAS-SK RNAi] 50.0%, [ppk>SK RNAi] 79.2%; Fisher’s exact test with Holm correction). *p<0.05, **p<0.01, ***p<0.001.

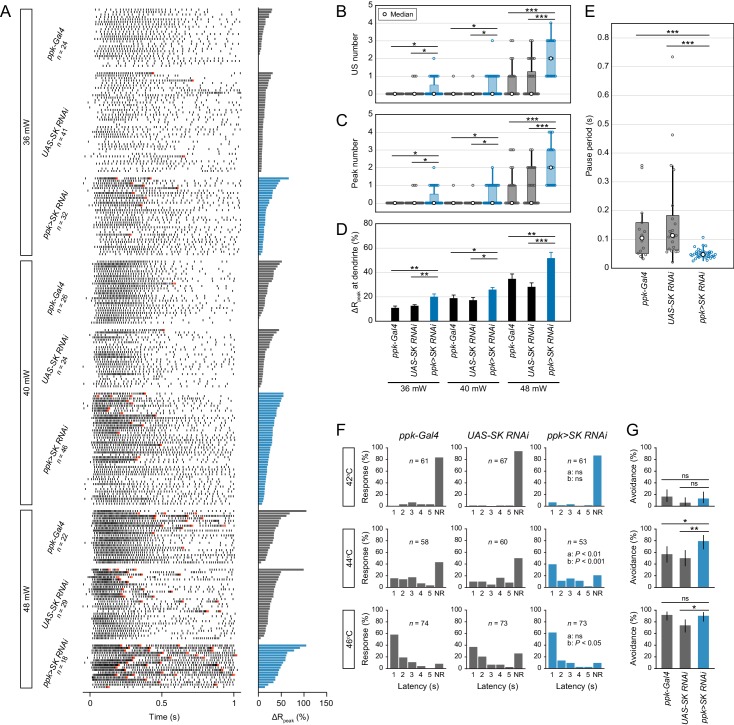
Figure 3—source data 1. Source data for Figure 3.
DOI: 10.7554/eLife.29754.019
Figure 3—source data 2. Source data for Figure 3—figure supplement 1.
DOI: 10.7554/eLife.29754.020
Figure 3—source data 3. Source data for Figure 3—figure supplement 2.
DOI: 10.7554/eLife.29754.021
Figure 3—source data 4. Source data for Figure 3—figure supplement 3.
DOI: 10.7554/eLife.29754.022
Figure 3—source data 5. Source data for Figure 3—figure supplement 4.
DOI: 10.7554/eLife.29754.023
Figure 3—source data 6. Source data for Figure 3—figure supplement 5.
DOI: 10.7554/eLife.29754.024

Figure 3.

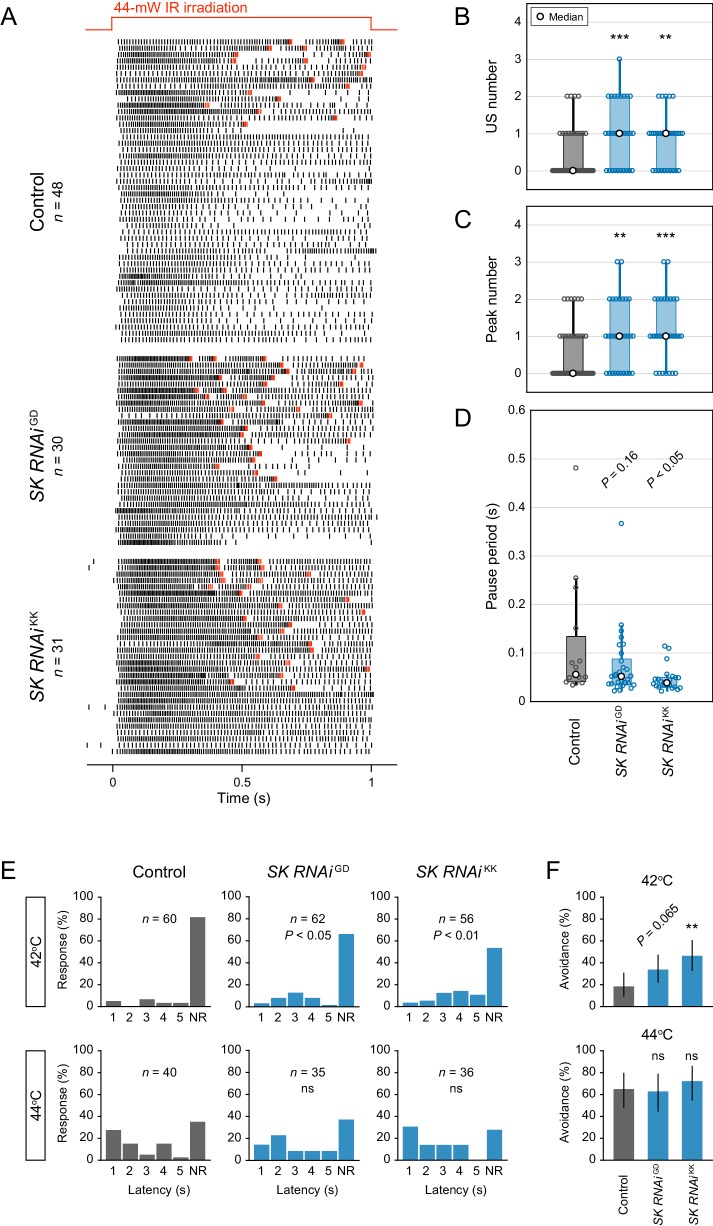
Figure 3—figure supplement 1. Maximum firing rates regarding the presence of USs and the effect of SK knockdown.

Figure 3—figure supplement 1.

(Left 3 columns) Data were classified into two groups: non-US and US. When USs occurred, the maximum firing rate tended to increase and several time points of the maximum firing rate overlapped with US timings. Gray bars indicate mean + s.e.m., and the right scatter plots show the distribution of all trials (see the bottom box). (Right 1 column) Maximum firing rate including both non-US and US trials. SK knockdown tended to increase the maximum firing rates upon all laser powers tested. Black bars indicate mean +s.e.m. (A) Quantification of Figure 3A. (B) Quantification of Figure 3—figure supplement 2A. *p<0.05, **p<0.01, ***p<0.001, Student’s t-test with Holm correction.
Figure 3—figure supplement 2. Analysis of two different SK knockdowns.

Figure 3—figure supplement 2.

(A–D) Responses of control neurons and two different SK knockdown neurons (ppk>SK RNAiGD12601, ppk>SK RNAiKK107699) with different target sequences. The 44 mW IR laser was focused onto the proximal dendritic arbors in filet preparations for 1 s (upper red line in A). (A) Raster plots of firing. Red raster lines indicate USs. (B and C) Both SK knockdowns increased the US number and peak number in Class IV neurons (Wilcoxon rank sum test with Holm correction). (D) Boxplots of the pause periods. Pause periods tended to decrease in the SK knockdown neurons (median: [Control] 55.3 ms (n = 15), [SK RNAiGD] 51.1 ms (n = 29), and [SK RNAiKK] 38.1 ms (n = 24); Student’s t-test with Holm correction). (E–F) Avoidance behavior of control and the two SK knockdown larvae in response to thermal stimulation (42°C and 44°C). The SK knockdown larvae displayed faster onsets of responses, and the frequency of responses tended to increase compared to the control (42°C). (E) The distribution of response latency (Wilcoxon rank sum test with Holm correction). NR, no response group. (F) Percentage of larvae responding within 5 s with 95% Clopper-Pearson confidence intervals (Fisher’s exact test with Holm correction). The pause periods were not completely abolished upon SK knockdown (see also Figure 3E), which raised the possibility that other Ca2+-activated K+ channels (e.g., slowpoke and slo2) could compensate for the loss of SK function. However, the pause periods of SK knockdown neurons did not decrease further by adding charybdotoxin (1 µM; KCa blocker; data not shown). *p<0.05, **p<0.01, ***p<0.001.
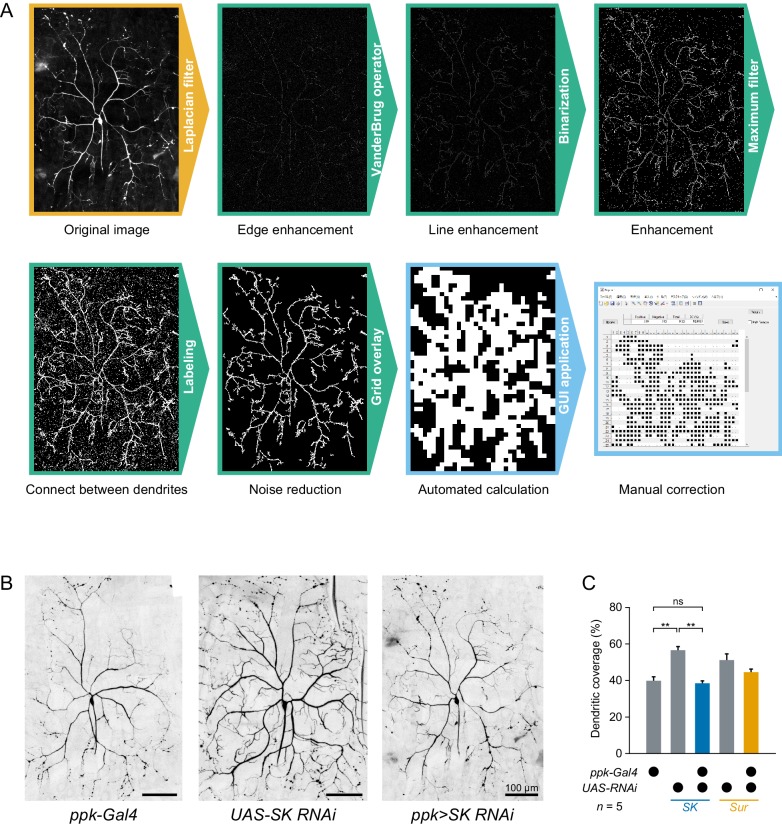
Figure 3—figure supplement 3. Dendritic morphology of SK knockdown Class IV neurons.

Figure 3—figure supplement 3.

It was recently reported that heat avoidance behavior is impaired in neuropeptide knockdown larvae, which show defects in the dendritic morphology of Class IV neurons (Honjo et al., 2016). This observation raised the possibility that such morphological defects might affect electrophysiological responses of the neurons. Therefore, we examined whether the SK knockdown also caused gross morphological defects in the neurons or not. To quantify dendritic morphology, we measured dendritic coverage (Honjo et al., 2016) with modifications. (A)Image processing for measuring dendritic coverage (see also Materials and methods). (B)Representative images of two control neurons and SK knockdown neurons. Here black and white in the original images are inverted to facilitate visualization. (C)Quantification of dendritic coverage ([ppk-Gal4] 39.8 ± 2.2%, [UAS-SK RNAi] 56.6 ± 2.0%, [ppk>SK RNAi] 38.4 ± 1.3%, mean ± s.e.m.; **p<0.01, Student’s t-test with Holm correction). Dendritic coverage of SK knockdown neurons did not increase compared to those of the two controls. These results indicate that the physiological alterations of SK knockdown neurons are not simply due to morphological defects of dendritic arbors, but are a direct consequence of the different composition of K+ channels. Although the dendritic coverage of UAS-SK RNAi was relatively higher than ppk-Gal4 and ppk>SK RNAi, the difference may be explained by the observation that the coverage of other transgenic neurons were different in the absence or presence of ppk-Gal4 drivers ([UAS-Sur RNAi] 51.2 ± 3.4%, [ppk>Sur RNAi] 44.6 ± 1.6%, mean ± s.e.m.).
Figure 3—figure supplement 4. Avoidance behavior and spontaneous spikes upon knockdown of the other K+ channels.

Figure 3—figure supplement 4.

(A–B) Avoidance behavior of driver control larvae (ppk-Gal4) and the knockdown larvae of three K+ channels (Shal, Irk2, and Task7 RNAi) in response to thermal stimulation (A: 42°C, B: 44°C). Percentage of larvae responding within 5 s did not change significantly in the knockdown larvae (Fisher’s exact test). Black bars indicate 95% Clopper-Pearson confidence intervals. We could not investigate the behavior of Sh knockdown larvae because they hardly developed into mature larvae. (C) Representative recordings of spontaneous spikes in knockdown Class IV neurons. (D) Spontaneous spike rate in knockdown neurons. The rates were quantified from the spike trains for 3 s before stimulation ([ppk-Gal4] n = 22, [others] see Figure 2—source data 1). The rates increased upon Shal, Irk2 and Task7 knockdowns; however, that of SK knockdown did not change significantly (Wilcoxon rank sum test compared to ppk-Gal4 driver control). Bottom horizontal labels indicate symbols of knocked down genes and upper labels represent channel families: Kv, voltage-gated K+ channel; KCa, Ca2+-activated K+ channel; Kir, Inward rectifier K+ channel; K2P, Two-pore domain K+ channel. *p<0.05, **p<0.01, ***p<0.001.
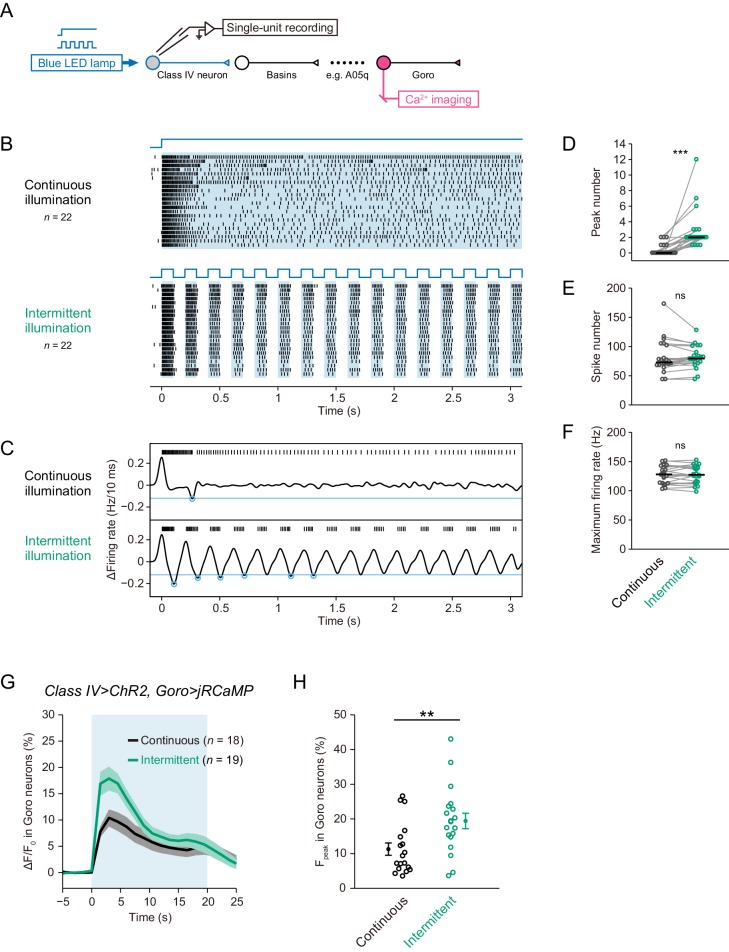
Figure 3—figure supplement 5. Differential Ca2+ dynamics of downstream neurons induced by optogenetic activations of Class IV neurons.

Figure 3—figure supplement 5.

(A) A schematic diagram of the recording system. We activated ChR2-expressing Class IV neurons by blue LED illumination (0.37 mW/mm2) and measured the firing responses by extracellular recording in filet preparations. We also acquired Ca2+ dynamics of jRCaMP-expressing downstream neurons in optimized preparations. (B–F) Responses of Class IV neurons activated with a blue LED for 3 s in a continuous fashion (‘continuous illumination’) or in a pulsatile one (‘intermittent illumination’). Each cell was stimulated by two illumination patterns temporally separated by a short resting interval of at least 1.5 min. (B)Raster plots of firing. Upper blue lines indicate the time course of LED illumination. (C) Representative traces of spike trains and the time derivative. Blue circles indicate negative peaks of the time derivative below a threshold (blue line, −12 Hz/10 ms). Even continuous illumination induced one or two peaks in some trials possible because of endogenous L-type VGCCs, but the number was much less than that upon intermittent illumination. (D–F) Intermittent illumination induced more peak number in Class IV neurons than continuous illumination did (D; Wilcoxon signed-rank sum test); however, the two illumination patterns did not change total spike number (E; Wilcoxon signed-rank sum test) and maximum firing rate (F; Paired-sample t-test). Black short bars indicate median. (G–H) Ca2+ dynamics of jRCaMP-expressing Goro neurons induced by optogenetic activations of Class IV neurons with a blue LED for 20 s (blue shade in G). Each sample was illuminated with a continuous or intermittent pattern. (G) Time courses of Ca2+ levels at soma (mean ± s.e.m.). The fluorescence rapidly increased within the first 3 s upon both illuminations. (H)Maximum amplitudes of Ca2+ rises were larger upon intermittent activation than a continuous one (Welch’s t-test). Dots and bars are mean ± s.e.m. *p<0.05, **p<0.01, ***p<0.001.