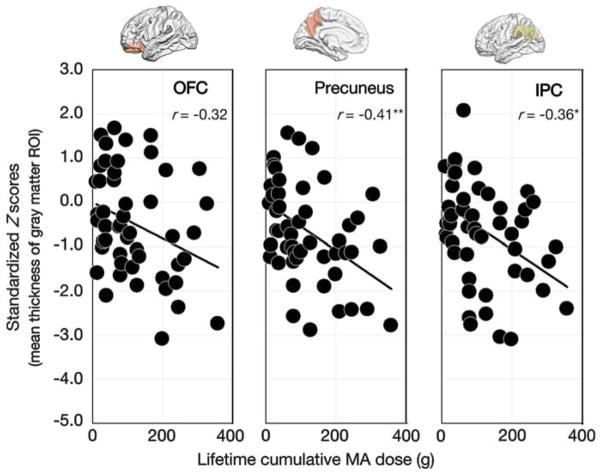
Figure 2.
Relationships between lifetime cumulative dose of methamphetamine (MA) and standardized Z-scores for mean thickness of gray matter regions of interest (ROIs) in adolescent MA users. Scatter plots and regression lines indicate the relationships between lifetime cumulative dose of MA and standardized Z-scores for thickness of gray matter ROIs (OFC, r =− 0.32, P =0.07; precuneus, r =− 0.41, P =0.009; inferior parietal cortex (IPC), r =− 0.36, P =0.03) in adolescent MA users. *P<0.05; **P<0.01.

