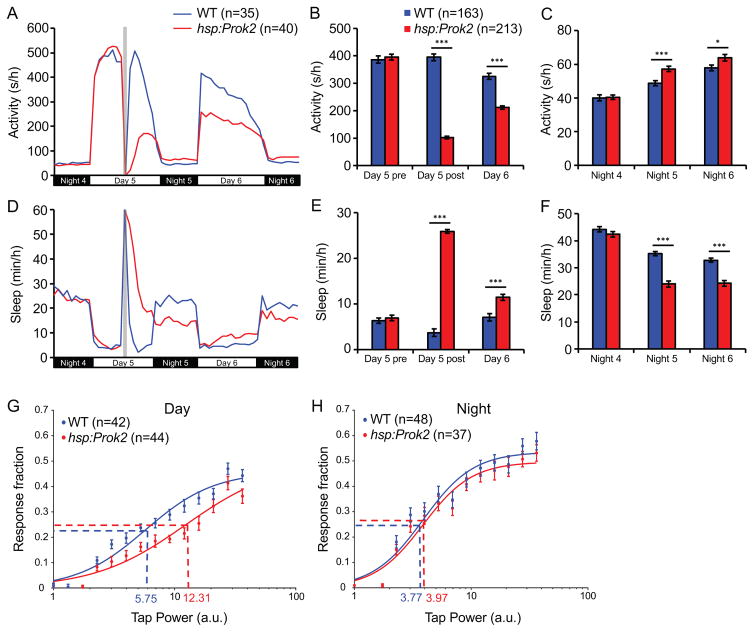
Figure 2. Prok2 overexpression increases sleep during the day and decreases sleep at night.
Heat shock (gray bar in (A, D)) during the day decreases locomotor activity during the day (A, B) and increases locomotor activity at night (A, C) for Tg(hsp:Prok2) larvae compared to their WT siblings. Prok2 overexpression also increases sleep during the day (D, E) and decreases sleep at night (D, F). These phenotypes were observed for over 36 hours after heat shock. Data from one representative experiment (A, D) and five experiments combined (B, C, E, F) are shown. Bar graphs show mean ± SEM. n indicates number of larvae analyzed. *p<0.05, ***p<0.001 by two-tailed Student’s t test. (G, H) Stimulus-response curve for Tg(hsp:Prok2) larvae compared to their WT siblings during the day (G) and at night (H) following heat shock during the day. Each data point represents mean ± SEM. Dashed lines mark the ETP50 value for each genotype. During the day (G), Tg(hsp:Prok2) larvae have an ETP50 value of 12.31 compared to 5.75 for WT (114.1% increase, p<0.01 by extra sum-of-squares F test). At night (H), Tg(hsp:Prok2) larvae have an ETP50 value of 3.77 compared to 3.97 for WT (5.3% increase, p=0.66 by extra sum-of-squares F test). n = number of larvae. See also Figure S2.

