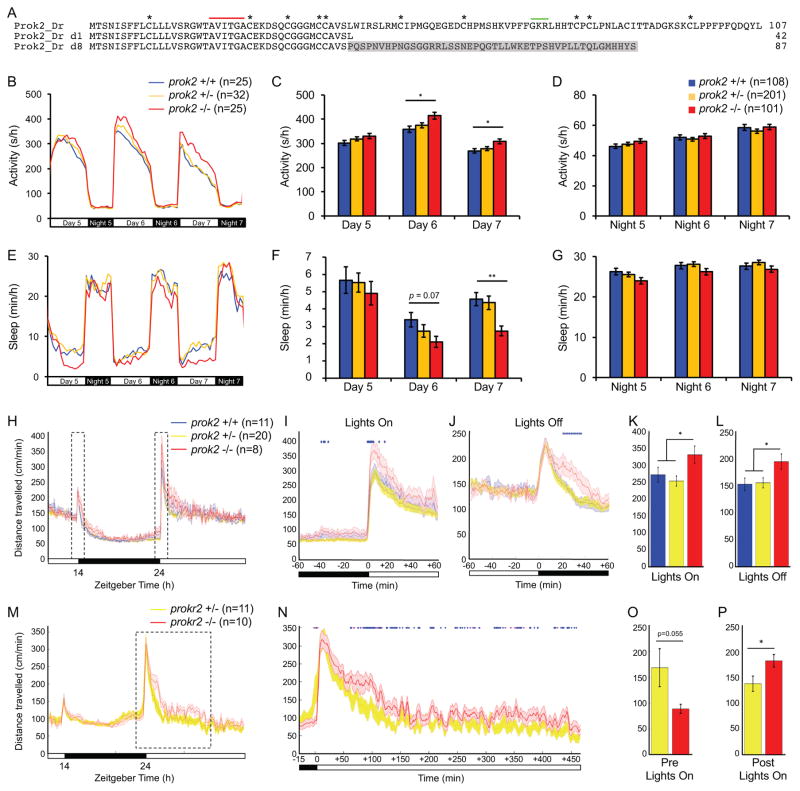
Figure 5. prok2 mutant larvae and prokr2 mutant adults are more active during the day.
(A) Amino acid sequences of two zebrafish Prok2 mutant proteins (d1 and d8) compared to WT. Asterisks mark conserved cysteine residues. Red line indicates a region conserved in human, rodent, frog and zebrafish. Green line indicates putative peptide cleavage site. Gray shading indicates altered sequence in mutant d8. Both mutants exhibited similar phenotypes and d8 was used for all reported experiments. (B–G) During the day at 6 and 7 dpf, prok2−/− larvae are more active (B, C) and sleep less (E, F) than their prok2+/− and prok2+/+ siblings. Data from one representative experiment (B, E) and five experiments combined (C, D, F, G) are shown. Bar graphs show mean ± SEM. (H–L) prok2−/− adults are more active at dawn and twilight. (H) 24-hour time course of mean ± SEM distance traveled, averaged over 3 days. Boxed regions are expanded to show dawn (I) and twilight (J). Mean ± SEM distance traveled during the first hour of light at dawn (K) and the first hour of dark at twilight (L). (M–P) prokr2−/− adults are more active during the day and show a trend of less activity before dawn. (M) 24-hour time course of mean ± SEM distance traveled, averaged over 2 days. The boxed region is expanded in (N). The data are smoothed over a 5-minute sliding window. Mean ± SEM distance traveled during 15 minutes of dark before dawn (O) and 450 minutes of light after dawn (P). Females and prokr2+/+ animals were not analyzed because too few such individuals were present in the dataset to allow statistically robust analysis. In (I, J, N), blue and magenta diamonds indicate one-minute periods for which p<0.05 or 0.05<p<0.07, respectively (repeated measures ANOVA). n = number of animals. *p<0.05 and **p<0.01 by one-way ANOVA with post-hoc Tukey’s test (K, L) or Dunnett’s test for comparisons to WT (C, F). See also Figure S5.

