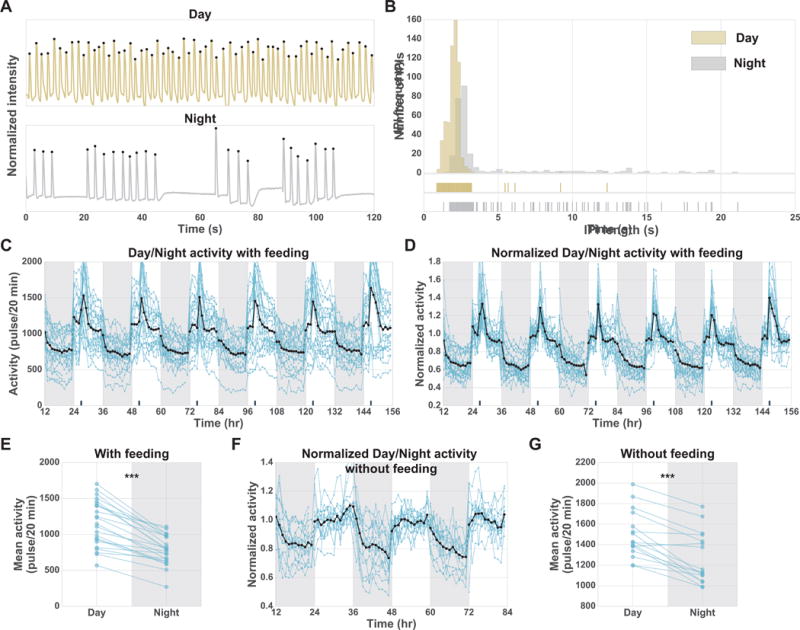
Figure 2. Continuous tracking of Cassiopea reveals pulsing quiescence at night.

(A) Pulsing-traces for individual jellyfish during day and night over 120 s. (B) The distribution of IPI length for a 12-hour day and a 12-hour night for the same jellyfish shown in A. Tick marks below the distribution show each IPI length during the day and night. This highlights the long-pause events, which are more common at night (Figure S3A; Data S1). (C-G) Each blue line corresponds to a single jellyfish. The black line indicates the mean activity of all jellyfish. Dark gray shading indicates night periods. Dark tick marks on the x-axis indicate time of feeding. (C) Baseline activity (pulses/20 min) of 23 jellyfish tracked for six days from four laboratory replicates. (D) Normalized baseline activity for jellyfish shown in C, where each jellyfish is normalized by their mean day activity. (E) Mean day activity versus mean night activity for each jellyfish over the six-day experiment shown in C. Two-sided paired t-test, day versus night, P = 6×10⁻⁹. (F) Normalized baseline activity without feeding of 16 jellyfish tracked over three days from two laboratory replicates, where each jellyfish is normalized by its mean day activity. (G) Mean day activity versus mean night activity for each jellyfish over the three-day experiment shown in F. Two-sided paired t-test, day versus night, P =10−5. ***P<10−3. See Figure S3.
