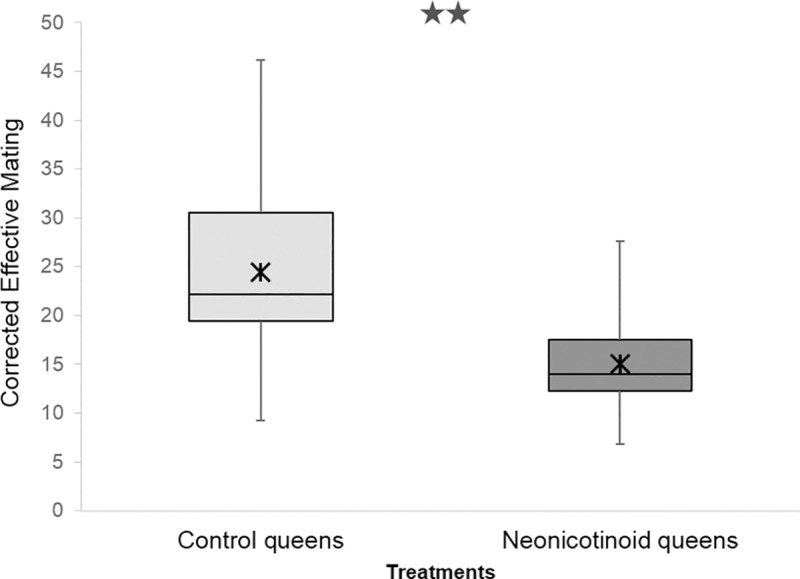
Fig 1. Corrected Effective Mating inferred from offspring DNA genotyping of control and neonicotinoid honeybee queens (Apis mellifera).

Boxplot shows inter-quartile range (box), median (black line within interquartile range), means (black asterisk); data range (dashed vertical lines). Queens exposed to neonicotinoid pesticides during their developmental stage mated with fewer males, resulting in lower Effective Matings than control queens. *P≤0.1, **P≤0.05, ***P≤0.01 (comparison with Controls).
