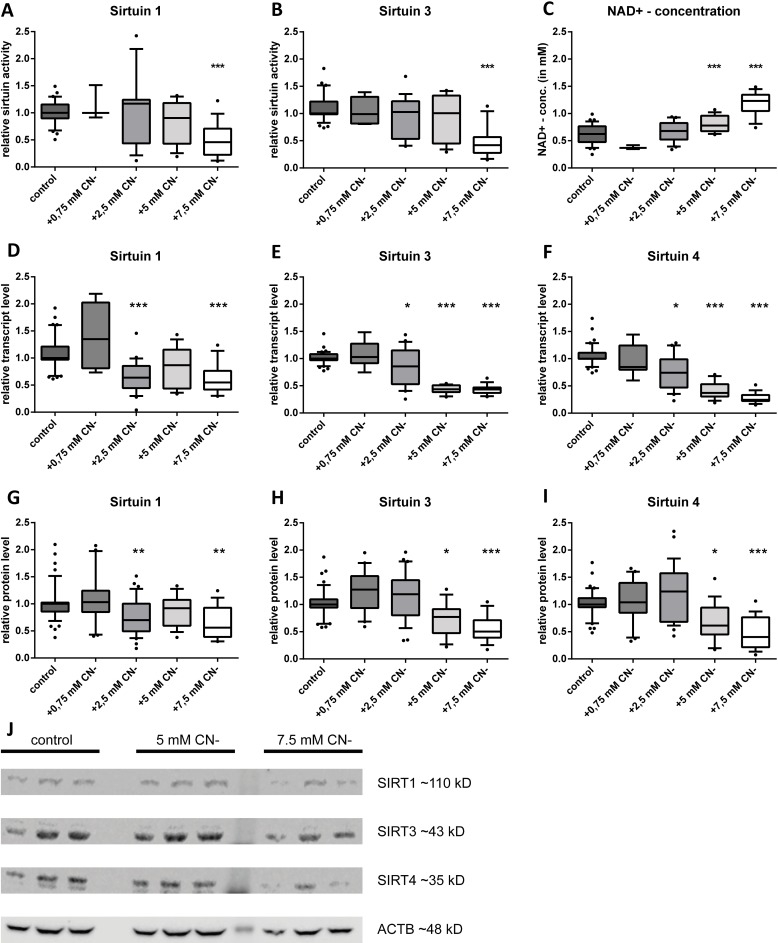
Fig 2. Sodium cyanide decreased intracellular SIRT1, SIRT3 and SIRT4 levels in a dose-dependent manner, whereas the intracellular NAD+-concentration was increased in a dose-dependent way.
Relative deacetylase activity of SIRT1 (A) and SIRT3(B). Always shown as different NaCN concentrations compared to control cells. (C) Intracellular NAD+ concentrations in healthy control fibroblasts and fibroblasts treated with increasing sodium cyanide concentrations. (D-F) Transcript levels of sirt1, sirt3 and sirt4. The mRNA levels are shown with increasing NaCN concentrations compared to the untreated control. (G-I) Relative protein levels of SIRT1, SIRT3 and SIRT4 in control cells compared to NaCN treated cells. (J) Representative Western blots of SIRT1, SIRT3 and SIRT4 as well as ACTB as internal control. (n = 5; NaCN treated fibroblasts vs control cells, median with 5% and 95% quantiles; * p < 0.05, ** p < 0.01, *** p < 0.001).

