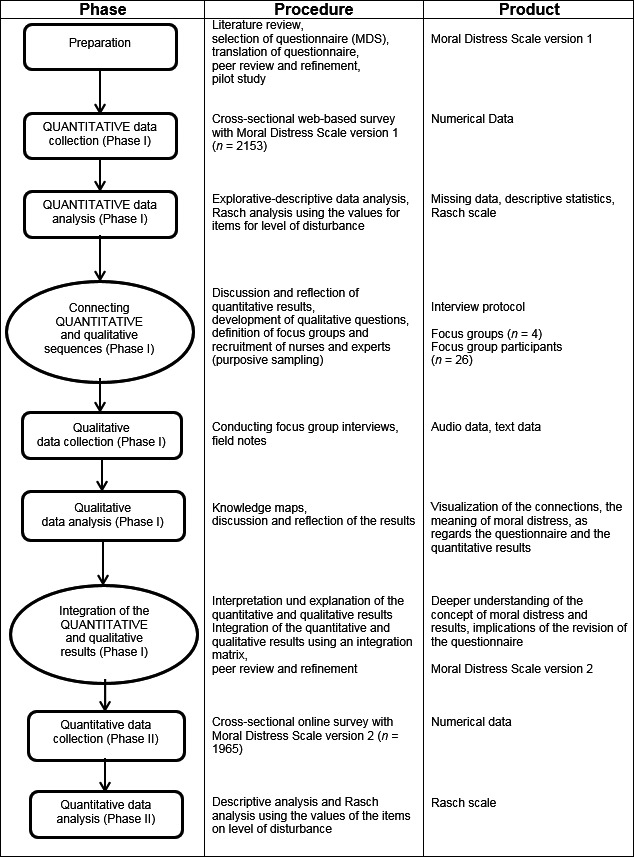
Figure 1.

Flow chart of the sequential explanatory design procedures with repetition of the quantitative cross‐sectional survey in accordance with Ivankova et al. (2006)

Flow chart of the sequential explanatory design procedures with repetition of the quantitative cross‐sectional survey in accordance with Ivankova et al. (2006)