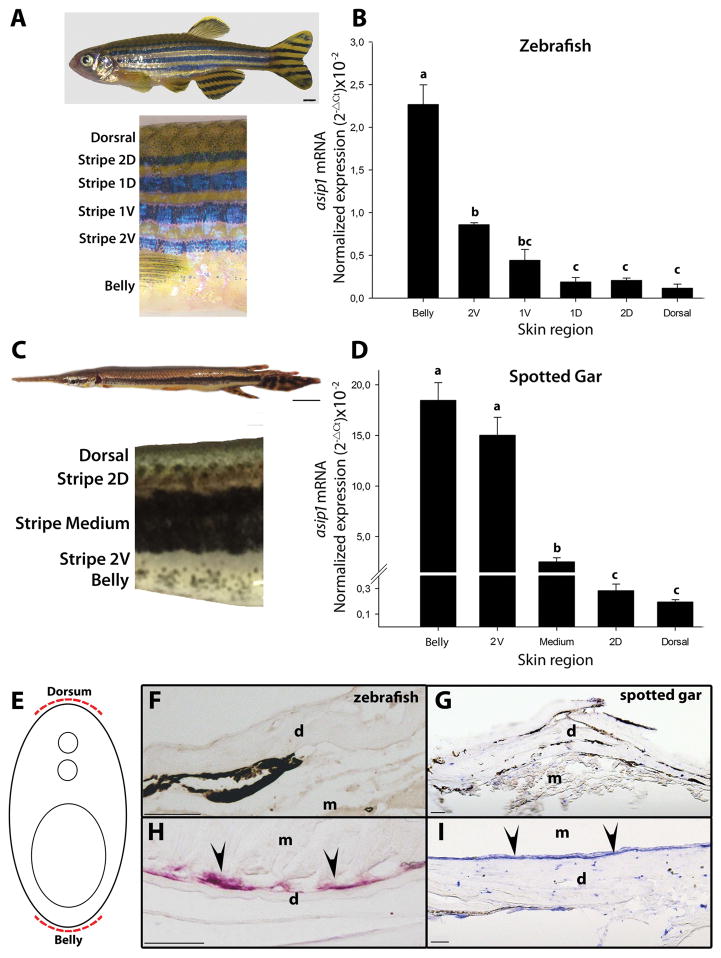
Figure 3.
Dorso-ventral gradient expression of asip1 in adult zebrafish (A) and spotted gar skin (C). Normalized gene expression levels of (B) zebrafish and (D) spotted gar asip1 in skin samples from belly to dorsum (locations of skin sample points are indicated in the picture). Shown are log 10-transformed ΔCt values of asip1 relative to eEf1α and β-actin, respectively. Data are the mean ±SEM from eight samples after triplicate PCR analysis. (E) Schematic representation of the rostro-caudal transverse sections. (F–I) Rostro-caudal transverse sections (12 μm thick) of paraffin embedded, in situ hybridization of asip1 expression in 210 dpf zebrafish (F,H) and 270dpf spotted gar (G,I). The sections in (H,I) shows the expression of asip1 transcripts in the dermis region of zebrafish (H) and spotted gar (I) ventral skin (black arrows). No aisp1 expression was found in the dermis region of dorsal skin of both species (C,D). Superscripts a, b, c and d indicate statistical differences (P<0.05) in gene expression levels among skin region (statistics data are similar if share at least one letter not sure what you mean). Scale bar: (A) 2 mm, (C) 1 cm, (F,G,H,I) 50 μm. d, dermis; m, muscle.

