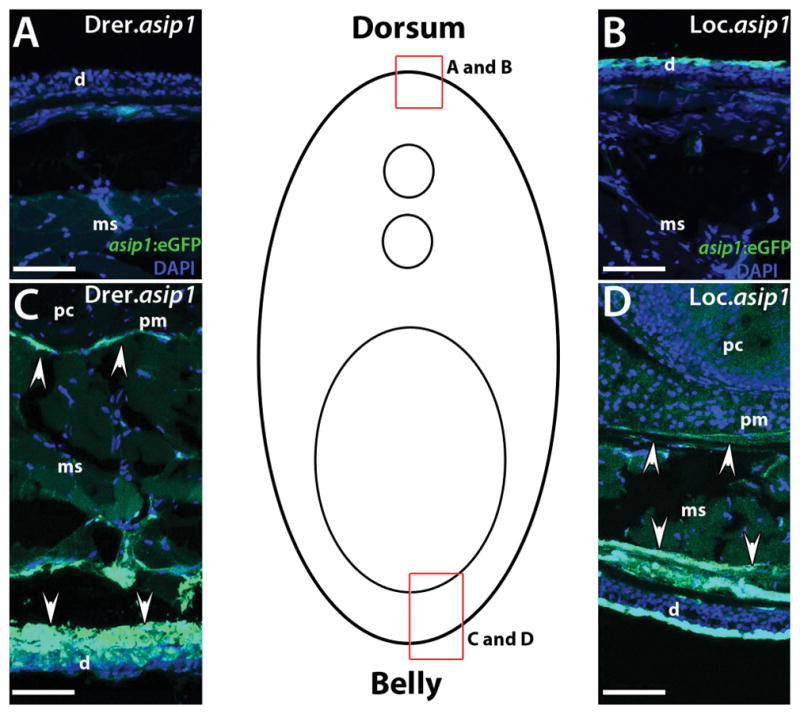
Figure 5.

Comparison of eGFP expression in rostro-caudal transverse sections (25 μm) from 150dpf Drer.asip1-iTol2-eGFP-BAC (A,C) and the Loc.asip1-iTol2-eGFP-BAC (B,D) transgenic zebrafish. Drer.asip1-iTol2-eGFP-BAC and Loc.asip1-iTol2-eGFP-BAC zebrafish show strong eGFP expression in the ventral skin region (dermis) and peritoneal membrane (C,D). Variegated eGFP fluorescence is seen in Loc.asip1-iTol2-eGFP-BAC dorsal dermis area (B). Cells that do not express eGFP are revealed with DAPI staining (blue color). Scale bars: 50 μm. d, dermis; ms, muscle; pc, peritoneal cavity; pm, peritoneal membrane.
