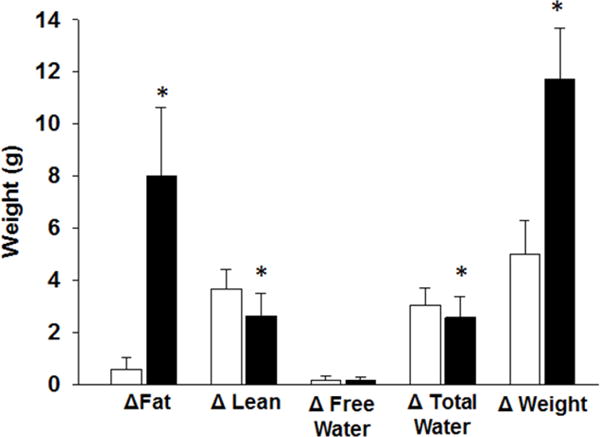
Figure 1. EchoMRI to determine body composition of mice fed normal and high-fat diets for 6 weeks.

Changes in body fat, lean mass, free water, total water and total weight prior to and after dietary intervention. Values are means ± SEM. White bars=non-obese mice fed normal diet, Black bars=obese mice fed high-fat diet. n=12–13/group. *p<0.05 compared to normal diet.
