
Figure 3. Cardiac gene expression in obese and non-obese mice after sepsis.
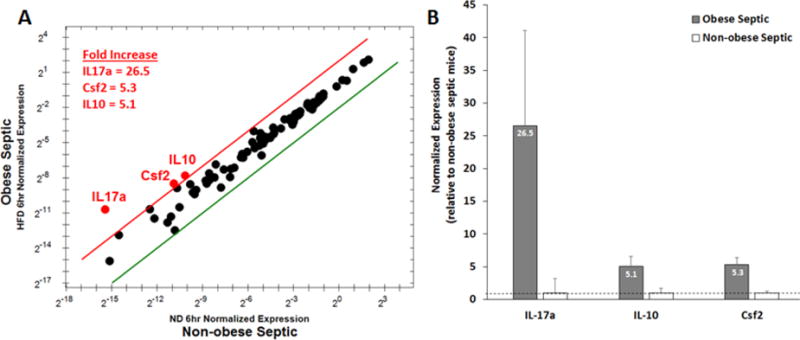
Gene expression profile of 90 genes related to IL-6/STAT3 signaling were evaluated at 6h after CLP in obese and non-obese mice. (A) Center dots represent unchanged gene expression. Boundary lines indicate 4-fold gene regulation cut-off between septic obese and septic non-obese samples (red line, 4-fold upregulation; green line 4-fold downregulation). IL-17a, Csf2 and IL-10 demonstrate differences that represent more than a doubling (log 2 changes of >1) and that were statistically significant at P≤0.05. (B) Relative expression of IL-17a, Csf2 and IL-10 in obese septic mice normalized to non-obese septic mice. Grey bar = obese septic mice, White bar = non-obese septic mice. Dashed line is placed at 1 for reference. n=4 mice/group.