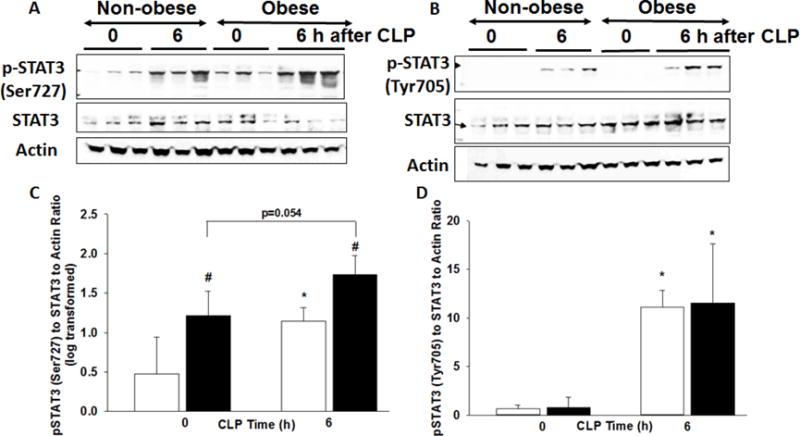
Figure 4. Phosphorylation of cardiac STAT3.

(A) changes in phosphorylation of STAT3 at serine 727 and (B) tyrosine 705, total STAT3 and actin expression in heart nuclear extracts by Western blot at 0 and 6h after CLP. Densitometric analysis of (C) pSTAT3 (Ser727) to STAT3 to Actin ratio log transformed and (D) pSTAT3 (Tyr705) to STAT3 to Actin ratio. *p<0.05 vs. time 0, #p<0.05 vs. non-obese mice by 2-way ANOVA. White bars=non-obese, Black bars=obese. n=3-4mice/group for densitometric analysis.
