
Figure 6. Cardiac expression of gp130.
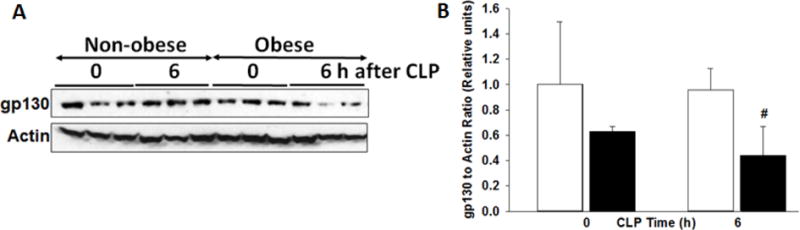
(A) Expression of gp130 and actin in heart cytosol extracts by Western blot analysis at 0 and 6h after CLP. (B) Densitometric analysis of gp130 to actin ratio. #p<0.05 vs non-obese group by 2-way ANOVA. White bars=non-obese, Black bars=obese. n=3–4mice/group for densitometric analysis.