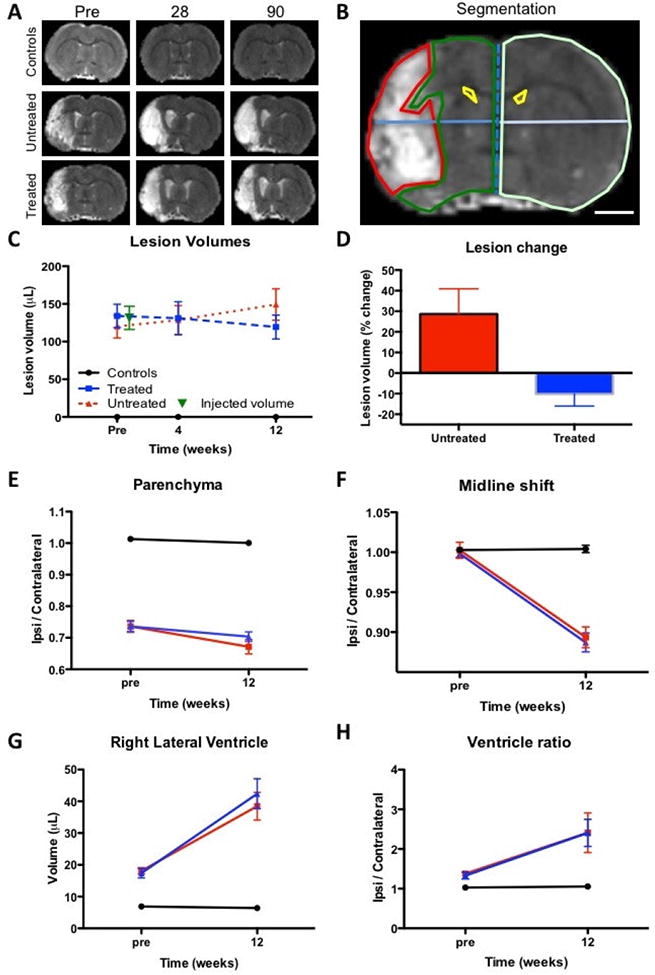
Figure 2. Evolution of lesion volume and tissue deformation.

A T2-weighted MR images of experimental groups over time reveal the hyperintense lesion cavity in animals with stroke damage. B. Measurement of lesion volume (red region-of-interest) based on the hyperintense T2-weighted signal on MR images defined by mean signal of the contralateral hemisphere + 1 standard deviation (scale bar 2 mm). Ipsilateral (green) and contralateral (light green) parenchymal tissue, lateral ventricles (yellow) were also segmented on MR images. Midline shift (blue line) was calculated by a ratio between distance of the ipsilateral and contralateral hemisphere midpoints. C. Lesion volume was calculated for a baseline pre-implantation time point, as well as for 4 and 12 weeks post-implantation. D. To account for variations in lesion volume at baseline, % change between baseline and 12 weeks were calculated. E. A ratio of parenchymal volume revealed a significant loss of parenchyma in stroke animals, which further declined a little over 12 weeks. F. A gradual shift of the midline was evident in both stroke groups, but was not impacted by ECM hydrogel implantation. G. An equivalent dramatic increase in ipsilateral lateral ventricle was evident in both stroke groups. H. The ratio between the ipsilateral and contralateral ventricle further reflect these gradual long-term changes in tissue structure after stroke. ECM hydrogel did not affect these tissue deformations.
